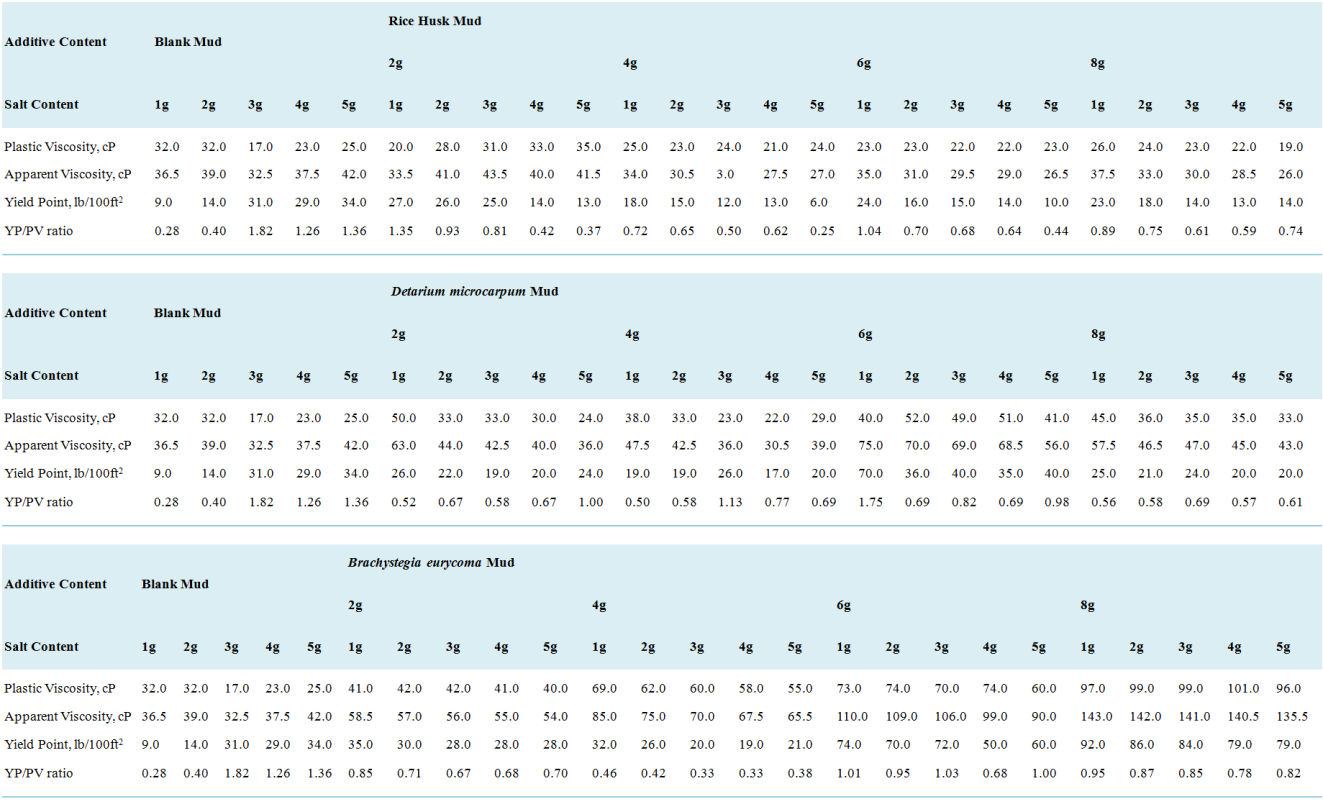
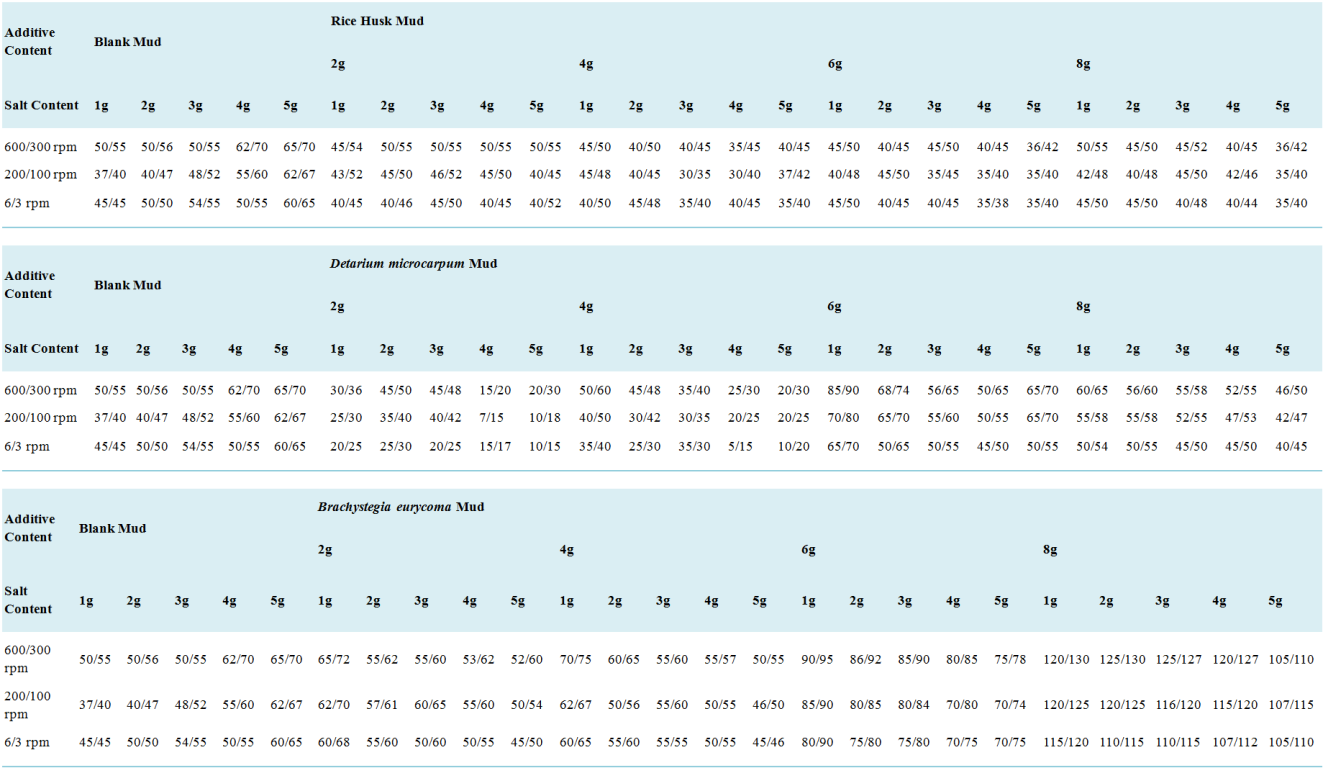
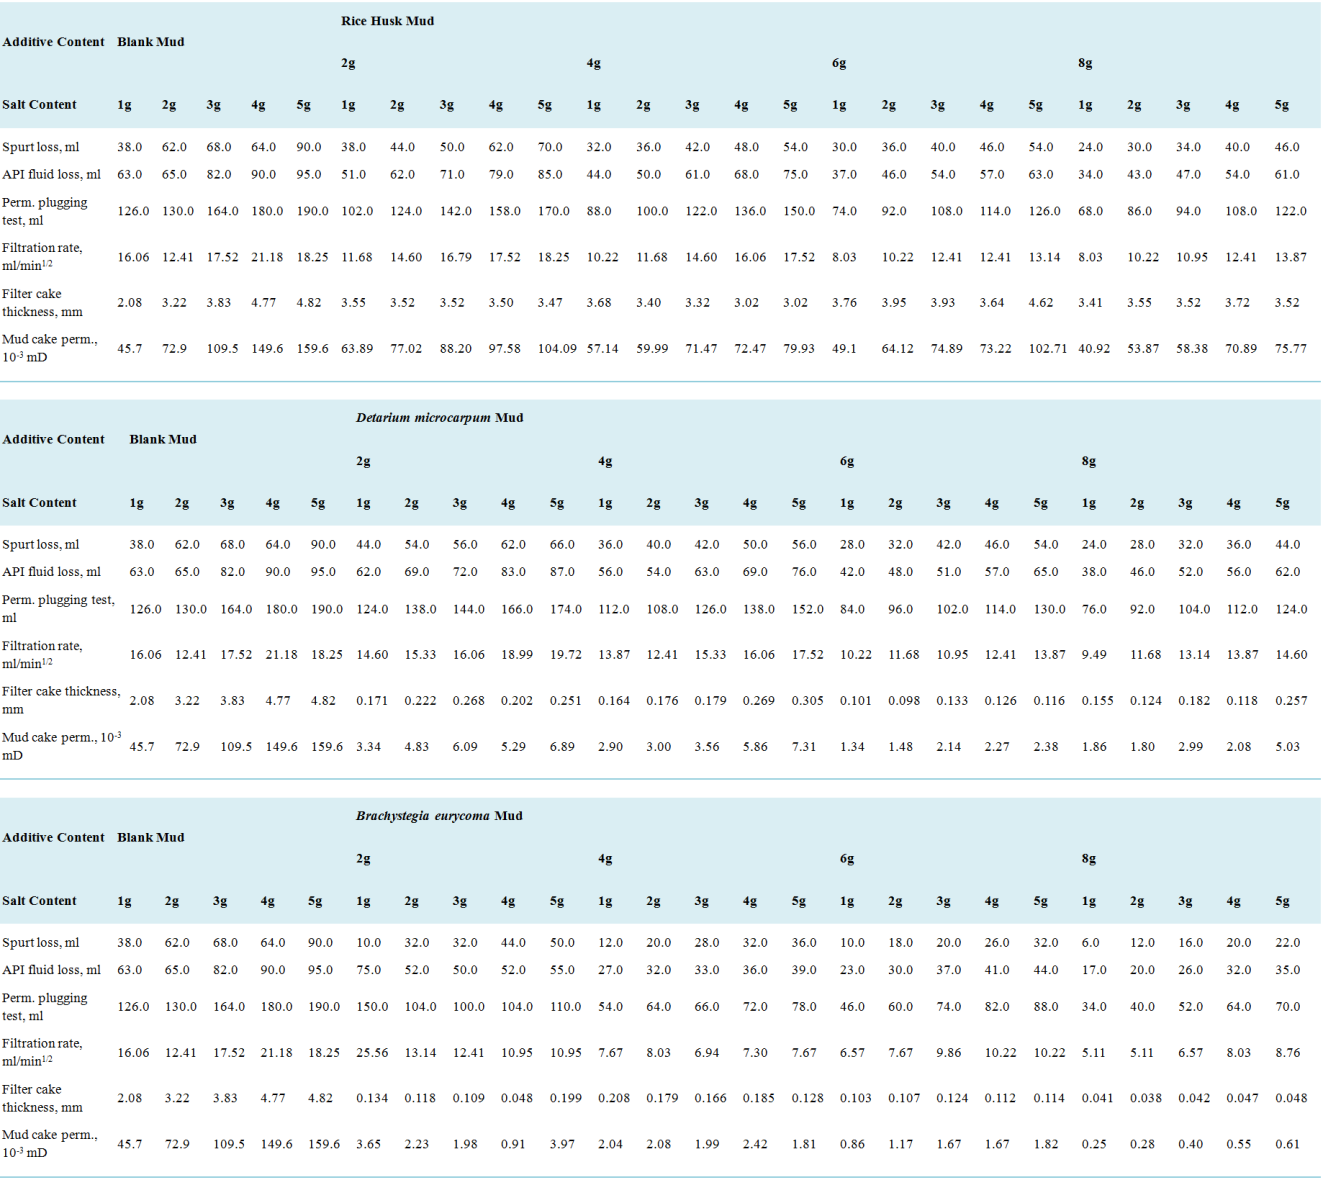
In drilling operations, chemical additives pose environmental concerns during mud disposal. This study evaluated three plant-based additives, namely rice husk (RH), Detarium microcarpum (DM), and Brachystegia eurycoma (BE), in oil-based mud at low-pressure, low-temperature conditions. The mud’s rheological profile followed Herschel Bulkley’s model. With 8 g additive content, RH increased the mud's apparent viscosity (AV), plastic viscosity (PV), and yield point (YP) by 62.5%, 51.25%, and 34.38%, respectively. DM showed higher increases of 200.0%, 195.0%, and 162.5%, while BE exhibited the most significant improvements of 287.5%, 272.5%, and 250.0%. The filtration tests indicated that RH reduced spurt loss and fluid loss volumes by 83.33% and 62.35%, while DM decreased by 82.41% and 47.94%, as BE had the highest reduction of 94.44% and 51.18%. Again, the filter cake thickness of RH, DM, and BE muds increased by 210.29%, 273.53%, and 79.41%, respectively, with permeabilities of 8.90×10⁻³ mD, 11.87×10⁻³ mD, and 7.35×10⁻³ mD. Furthermore, the mud susceptibility to NaCl showed that AV decreased for RH, DM, and BE, while YP decreased significantly. The filter cake thickness and permeability increased by 62.38 and 359.55% for RH, as the DM decreased by 93.80% and 84.37% and the BE by 96.68% and 96.62%, which indicates that RH is more susceptible to NaCl than DM and BE in the mud. Also, these plant-based additives in mud exhibited fragile gel strength and commendable cake characteristics: firm, smooth, and soft/slippery, which make them potentially suitable for oil well drilling.
| Published in | Petroleum Science and Engineering (Volume 8, Issue 2) |
| DOI | 10.11648/j.pse.20240802.13 |
| Page(s) | 100-124 |
| Creative Commons |
This is an Open Access article, distributed under the terms of the Creative Commons Attribution 4.0 International License (http://creativecommons.org/licenses/by/4.0/), which permits unrestricted use, distribution and reproduction in any medium or format, provided the original work is properly cited. |
| Copyright |
Copyright © The Author(s), 2024. Published by Science Publishing Group |
Rice Husk, Detarium Microcarpum, Brachystegia Eurycoma, Rheological Properties, Filtration Loss Properties, Salt Contamination, Drilling Mud
Author | Materials | Content /Concentration | Particle Size | Mud Type | Test | Test Conditions | Findings / Results | |
|---|---|---|---|---|---|---|---|---|
i. | Okon et al. [ 9] | Rice husk | 5, 10, 15, and 20 g | 125 µm | WBM | Filtration | LPLT: 100 psi and room temp. | A fluid loss reduction of 64.89% was achieved with 20 g additive content. |
ii. | Amanullah et al. [ 21] | Date seed powder | 6 g | < 150 µm | Fresh and salty WBM | Fluid loss | HPHT: 500 psi and 100°C | Fluid loss reductions of 60.43% and 63.41% were achieved for the fresh and salty WBM, respectively. |
iii. | Davoodi et al. [1 8] | Pistachio shell powder | 9 g | > 75 µm 120 – 180 µm | WBM | Filtration loss | LPLT and HPHT | Fluid loss reductions of 44% and 39% were achieved at the LPLT and HPHT conditions, respectively. |
iv. | Al-Hameedi et al. [1 7] | Grass powder and starch | 3.5, 7.0 and 10.5 g | N/A | WBM | Filtration loss | LPLT: 100 psi and 75 oF HPHT:500 psi and 250 oF | Fluid loss reductions of 45% and 26% were achieved at the LPLT and HPHT conditions, respectively. |
v. | Katende et al. [1 3] | Nanosilica | 0.5, 1.0, and 1.5 ppb | 14 µm | WBM and OBM | Fluid loss reducer and Rheological properties | High temp: ambient – 300 oF HPHT filtration test | The nanosilica improves the rheological properties of both WBM and OBM. However, its performance for HPHT fluid loss was not successfully improved. |
vi. | Ghaderi et al. [2 2] | Saffron purple petals | 1, 2, and 3 wt.% | N/A | WBM | Rheological, filtration and corrosion | LPLT:100 psi and 25°C | Filtrate volume reductions of 23.7, 36.6 and 45.0% for 1, 2, and 3 wt.% additive, respectively, were achieved. |
vii. | Al-Hameedi et al. [1 4] | Black sunflower seeds’ shell powder | 0.5 – 3.5 wt.% (i.e., 3.5 – 24.5 grams) | 52 – 400 µm | WBM | Rheological and fluid loss measurements | LPLT: 100 psi and 75 oF HPHT:500 psi and 250 oF | Increasing the concentration of the additive increased the yield point with less impact on plastic viscosity. Also, the filtration characteristics of the additive for both LPLT and HPHT were comparable to those of the standard polymer. |
viii. | Davoodi et al. [2 3] | Acorn shell powder | 3, 5, 7, and 9 g | 100 – 350 µm | WBM | Rheological and filtration | LPLT and HPHT | Filtration reductions of 80.1% and 63.3 for HPHT and LPLT, respectively, were achieved. |
ix. | Yalman et al. [1 1] | Rice husk ash | 2 – 15 wt.% | 102.39 µm | WBM | Rheological and filtration | LPLT: Room temp and 0.68 MPa | With 4 wt.% content, a fluid loss reduction of 10% was achieved, while apparent viscosity and yield point increased by 60% and 183%, respectively, with 15 wt.% content. |
x. | Ebrahimi and Sanati [2 4] | Alyssum seeds | 0.5 and 1.0 wt.% | N/A | Water and brine-based muds | Rheological and filtration | LPLT | Fluid loss reductions of 34.48% for WBM and 35.01% for salty WBM were achieved. |
xi. | Boyi and Amadi [2 5] | ‘Ukpo’, ‘Achi’ and ‘Ofor’ | 5, 10, 15, and 20 g | N/A | WBM | Rheological properties | N/A | The local additives showed potential to be used as a substitute for standard viscosifier (PAC-R) |
xii. | Ajiri et al. [2 6] | Sawdust and Coconut fiber | 2.5 and 5.0 g | N/A | WBM | Fluid loss | LPLT | A fluid loss reduction of 23.68% was achieved with 50:50 composite additives. |
xiii. | Ali et al. [2 7] | Potato powder | 0.5, 1.0, and 2.0 wt.% | 5 – 600 µm | WBM | Filtration, Rheological & Morphological | LPLT: 100 psi and 25, 50 & 75°C, HPHT:1800 psi and 500 oF | The potato powder provides better filtration and rheological properties with fluid loss reduction of about 43.5% at the additive concentration of 1 wt.% |
Mud components | Additive function | Content | Mixing order | Mixing during (min) |
|---|---|---|---|---|
Diesel and distill water (ml) | Base fluids | 350 | 1 | -- |
Bentonite, (g) | Primary viscosifier | 25 | 2 | 5 |
Barite, (g) | Densifier | 10 | 3 | 5 |
Soda ash, (g) | pH control | 0.25 | 4 | 2 |
Emulsifier, (ml) | Proper mixing of the base fluids | 2.0 | 5 | 5 |
Rice husk, (g) | Fluid loss control additive | 2, 4, 6, 8 | 6a | 5 |
Detarium microcarpum, (g) | Fluid loss control additive | 2, 4, 6, 8 | 6b | 5 |
Brachystegia eurycoma, (g) | Fluid loss control additive | 2, 4, 6, 8 | 6c | 5 |
Sodium Chloride, (g) | Contaminant for the mud salinity susceptibility test | 1, 2, 3, 4, 5 | 7 | 5 |
 (1)
(1)  (2)
(2)  (3)
(3)  ) of the mud samples was determined using Equation 4.
  (4)
(4)  is the spurt-loss volume, and
  and
and  denote filtrate volumes obtained at 7.5 minutes and 30 minutes, respectively. Equations 5 and 6 were used to determine the mud sample's PPT volume and static filtration rate.
  (5)
(5)  (6)
(6)  is the permeability plugging test volume,
  represents the static filtration rate and
  and
and  are as denoted in Equation 4. Again, to estimate the mud sample cake permeability, the mud filtrate (in Figure 14) viscosity was determined using a kinematic viscosity bath (Figure 15). Then, the mud samples’ cake permeability was determined using Equation 7. Further details for the development of Equation 7 are available in the works of Rautela
  (7)
(7)  is the cake permeability in millidarcy (mD),
  denotes the fluid loss volume in a cubic centimeter (cm3),
  represents the filter cake thickness in millimetre (mm) and
  is the mud filtrate viscosity in centipoise (cP)
 Mud Samples Type | BM | RH mud | DM mud | BE mud | |||||||||
|---|---|---|---|---|---|---|---|---|---|---|---|---|---|
Additives Content |
| 2g | 4g | 6g | 8g | 2g | 4g | 6g | 8g | 2g | 4g | 6g | 8g |
Plastic viscosity, cP | 24.0 | 30.0 | 34.0 | 37.0 | 39.0 | 65.0 | 78.0 | 72.0 | 76.0 | 58.0 | 82.0 | 91.0 | 93.0 |
Apparent viscosity, cP | 40.0 | 42.0 | 46.5 | 51.5 | 60.5 | 95.0 | 104.0 | 113.5 | 118.0 | 96.0 | 125.0 | 136.0 | 149.0 |
Yield point, Ib/100ft2 | 32.0 | 24.0 | 25.0 | 29.0 | 43.0 | 52.0 | 60.0 | 83.0 | 84.0 | 76.0 | 86.0 | 90.0 | 112.0 |
YP/PV ratio | 1.33 | 0.80 | 0.74 | 0.78 | 1.10 | 0.92 | 0.67 | 1.15 | 1.11 | 1.31 | 1.05 | 0.99 | 1.20 |
Viscometer Speed (rpm) | Additive Content | 10 seconds / 10 minutes Gel Strength | ||||
|---|---|---|---|---|---|---|
2g | 4g | 6g | 8g | |||
600/300 | BM | 47/53 | ||||
RH | 48/54 | 47/50 | 50/55 | 65/70 | ||
DM | 60/75 | 75/90 | 90/100 | 88/95 | ||
BE | 86/97 | 80/97 | 102/110 | 140/160 | ||
200/100 | BM | 46/52 | ||||
RH | 47/52 | 45/50 | 50/55 | 60/65 | ||
DM | 55/73 | 55/60 | 75/85 | 80/90 | ||
BE | 80/90 | 75/95 | 100/105 | 132/145 | ||
6/3 | BM | 45/50 | ||||
RH | 45/50 | 50/55 | 55/60 | 70/75 | ||
DM | 50/70 | 45/50 | 70/80 | 75/80 | ||
BE | 85/95 | 70/90 | 90/100 | 120/130 | ||
Mud sample type | BM mud | RH mud | DM mud | BE mud | |||||||||
|---|---|---|---|---|---|---|---|---|---|---|---|---|---|
Additives content | 2g | 4g | 6g | 8g | 2g | 4g | 6g | 8g | 2g | 4g | 6g | 8g | |
Time (min) | Fluid loss volume (ml) | ||||||||||||
5.0 | 20.4 | 16.4 | 10.5 | 8.0 | 5.8 | 14.7 | 10.4 | 9.8 | 7.8 | 14.2 | 10.4 | 7.4 | 6.8 |
7.5 | 22.4 | 18.6 | 14.2 | 10.6 | 7.3 | 17.6 | 12.4 | 11.6 | 9.8 | 18.2 | 12.6 | 9.2 | 8.6 |
10.0 | 26.4 | 24.0 | 18.8 | 12.8 | 8.0 | 23.0 | 18.8 | 17.2 | 16.0 | 20.4 | 18.8 | 10.4 | 9.8 |
30.0 | 34.0 | 30.0 | 24.6 | 18.4 | 12.8 | 29.6 | 21.5 | 20.6 | 17.7 | 30.0 | 22.0 | 17.4 | 16.6 |
Mud samples type | BM mud | RH mud | DM mud | BE mud | |||||||||
|---|---|---|---|---|---|---|---|---|---|---|---|---|---|
Additives content | 2g | 4g | 6g | 8g | 2g | 4g | 6g | 8g | 2g | 4g | 6g | 8g | |
Spurt loss, ml | 21.60 | 14.40 | 7.60 | 5.60 | 3.60 | 11.20 | 6.60 | 5.20 | 3.80 | 12.80 | 6.40 | 2.00 | 1.20 |
API fluid loss, ml | 34.0 | 30.0 | 24.6 | 18.4 | 12.8 | 29.6 | 21.5 | 20.6 | 17.7 | 30.0 | 22.0 | 17.4 | 16.6 |
Perm. plugging test, ml | 68.0 | 60.0 | 49.2 | 36.8 | 25.6 | 59.2 | 43.0 | 41.2 | 35.4 | 60.0 | 44.0 | 34.8 | 33.2 |
Filtration rate, ml/min1/2 | 8.47 | 8.32 | 7.59 | 5.70 | 4.02 | 8.76 | 6.64 | 6.57 | 5.77 | 8.62 | 6.86 | 5.99 | 5.84 |
Filter cake thickness, mm | 0.68 | 1.02 | 1.04 | 1.37 | 2.11 | 1.32 | 1.75 | 1.93 | 2.54 | 3.40 | 2.99 | 2.77 | 1.22 |
Mud cake perm., 10-3 mD | 8.06 | 10.80 | 9.53 | 9.03 | 8.90 | 14.18 | 12.54 | 12.33 | 11.87 | 37.04 | 23.88 | 17.50 | 7.35 |
Additive materials | Minimum cost (kg/$) | Maximum cost (kg/$) | Average cost (kg/$) | Average cost (tonne/$) | |
|---|---|---|---|---|---|
i. | Rice husk (RH) | 0.096 | 0.12 | 0.108 | 108 |
ii. | Detarium microcarpum (DM) | 0.67 | 1.34 | 1.005 | 1005 |
iii. | Brachystegia eurycoma (BE) | 0.81 | 1.61 | 1.21 | 1210 |
iv. | Carboxymethyl cellulose (CMC) | 2.33 | 4.67 | 3.50 | 3500 |
v. | Polyanionic cellulose (PAC) | 2.27 | 3.05 | 2.66 | 2660 |
vi. | Xanthan gum (XG) | 2.80 | 3.00 | 2.90 | 2900 |
Additives | Additive (ppb) | Cost per tonne ($/t) | Cost per bbl ($/bbl) | Cost for 840 bbl |
|---|---|---|---|---|
Sodium chloride* | 90 | 55 | 2.25 | 1890 |
Potassium chloride* | 20 | 75 | 0.68 | 571.2 |
Limestone* | 60 | 350 | 9.50 | 7980 |
XC polymer* | 0.6 | 1500 | 0.41 | 344.4 |
Starch* | 9.0 | 1200 | 4.90 | 4116 |
Caustic soda* | 0.5 | 300 | 0.10 | 84.0 |
Soda ash* | 0.5 | 900 | 0.20 | 168.0 |
CMC | 2.0 | 3500 | 3.18 | 2671.2 |
PAC | 2.0 | 2660 | 2.41 | 2024.4 |
XG | 2.0 | 2900 | 2.63 | 2209.2 |
RH | 7.5 | 108 | 0.38 | 319.2 |
DM | 7.5 | 590 | 2.01 | 1688.4 |
BE | 10 | 505 | 2.29 | 1923.6 |
Additives | Cost of 840 bbl mud (USD) | Percentage Cost Reduction (%) | ||
|---|---|---|---|---|
CMC | PAC | XG | ||
CMC | 17824.8 | - | - | - |
PAC | 17178.0 | - | - | - |
XG | 17362.8 | - | - | - |
RH | 15472.8 | 13.20 | 9.93 | 10.89 |
DM | 16842.0 | 5.51 | 1.96 | 3.00 |
BE | 17077.2 | 4.19 | 0.59 | 1.65 |
API | American Petroleum Institute |
AV | Apparent Viscosity |
BE | Brachystegia Eurycoma |
BM | Blank Mud |
CMC | Carboxymethyl Cellulose |
cP | Centipoise |
DM | Detarium Microcarpum |
g | Gram |
HPHT | High-Pressure High-Temperature |
k | Permeability |
LPLT | Low-Permeability Low-Temperature |
mD | Millidarcy |
mm | Millimetre |
MPa | Mega Pascal |
NaCl | Sodium Chloride |
OBM | Oil-Based Mud |
°C | Degree Celcius |
PAC | Paloanionic Cellulose |
PAC-R | Polyanionic Cellulose – Rheology |
pH | Hydrogen Ion Potential |
PPT | Permeability Plugging Test |
PV | Plastic Viscosity |
qst | Static Filtration Rate |
RH | Rice Husk |
rpm | Revolution Per Minute |
XG | Xanthan Gum |
USD | United State Dollars |
VPPT | Permeability Plugging Test Volume |
WBM | Water-Based Mud |
wt.% | Weight Percent |
µm | Microns |
YP | Yield Point |
| 300 and 600 Dial Reading |
| [1] | Udoh FD, Itah JJ, Okon AN (2012) Formulation of synthetic-based drilling fluid using palm oil derived ester. Asian J Microbio, Biotechnol Environ Sci, 14 (2): 175-180. |
| [2] | Agwu OE, Okon AN, Udoh FD (2015) A comparative study of diesel oil and soybean oil as oil-based drilling mud. J Pet Eng. |
| [3] | Villada Y, Busatto C, Casis N, Estenoz D (2022) Use of synthetic calcium carbonate particles as an additive in water-based drilling fluids. J Colloid and Surface A: Physiochem Eng Aspects, 2022: 129801. https://doi.org/10.1016/j.colsurfa.2022.129801 |
| [4] | Luo Z, Pei J, Wang L, Yu P, Chen Z (2017) Influence of an ionic liquid on rheological and filtration properties of water-based drilling fluids at high temperatures. J Applied Clay Sci, 136: 96-102. |
| [5] | Borah B, Das BM (2022) A review on applications of bio-products employed in drilling fluids to minimize environmental footprint. J Environ Challenges, 6: 1-18. |
| [6] | Kuma M, Das BM, Talukdar P (2020) The effect of salts and haematite on Carboxymethyl cellulose – bentonite and partially hydrolyzed polyacrylamide – bentonite muds for an effective drilling in shale formations. J Pet Explor Prod Technol, 10: 395-405. |
| [7] | Murtaza M, Tariq Z, Kamal MS, Rana A, Saleh TA, Mahmoud M, Alarifi SA, Syed NA (2024) Improving water-based drilling mud performance using biopolymer gum: integrating experimental and machine learning techniques. Molecules, 29, 2512. |
| [8] | Okon AN, Akpabio JU, Tugwell KW (2020) Evaluating the locally sourced materials as fluid loss control additives in water-based drilling fluid. Heliyon J, 6(5): 1-16. |
| [9] | Okon AN, Udoh FD, Bassey PG (2014) Evaluation of rice husk as fluid loss control additive in water-based drilling mud. Society of Petroleum Engineers (SPE), Nigeria Council 38th Nigeria Annual International Conference and Exhibition, Eko Hotel and Suite, Lagos, August 3-5, 2014. |
| [10] | Abdo J, Haneef MD (2013) Clay nanoparticles modified drilling fluids for drilling of deep hydrocarbon wells. J Applied Clay Sci, 86: 76-82. |
| [11] | Yalman E, Depci T, Federer-Kovacs G, Alkhalaf H (2021) A new eco-friendly and low-cost additive in water-based drilling fluids. The Mining-Geol-Pet Eng Bulletin. |
| [12] | Anawe-Paul AI, Efeovbokhan VE, Adebayo TA, Nwaogwugwu MM (2014) The effect of rice husk and sawdust on the properties of oil-based mud at varied temperatures. J Energy Technol and Policy, 4 (2): 267-309. |
| [13] | Katende A, Boyou NV, Ismail I, Chung DZ, Sagala F, Hussein N, Ismail MS (2019) Improving the performance of oil-based mud and water-based mud in a high-temperature hole using nanosilica nanoparticles. J Colloids and Surface A, 577: 645-673. |
| [14] | Al-Hameedi ATT, Alkinani HH, Alkhamis MM, Norman SD (2020) Utilizing a new eco-friendly drilling mud additive generated from wastes to minimize the use of the conventional chemical additives. J Pet Explor Prod Technol, 10: 3467-3481. |
| [15] | Oseh JO, Norddin MNAM, Duru UI, Ngouangna EN, Ismail I, Gbadamos AO, Agi A, Yahya MN, Oguamah IA (2024) Improvement in fluid loss control and viscosity of water-based drilling mud under high temperature and sodium chloride salt conditions using nanohydroxyapatite. J Eng Research, 21(1): 33-45. |
| [16] | Das B, Borah B, Bhattacharyya S (2020) Comparative analysis of carboxymethyl cellulose and partially hydrolyzed polyacrylamide – low-solid nondispersed drilling mud with respect to property enhancement and shale inhibition. J Resource-Efficient Technol, 2: 24-33. |
| [17] | Al-Hameedi ATT, Alkinani HH, Dunn-Norman S, Al-Alwani MA, Alshammari AF, Albazzaz HW, Alkhamis MM, Alashwak NF, Mutar RA (2019) Insights into the application of new eco-friendly drilling fluid additive to improve the fluid properties in water-based drilling fluid systems. J Pet Sci Eng, 183, 106424, |
| [18] | Davoodi S, Ahmad RSA, Jamshidi S, Jahromi AF (2018) A novel field applicable mud formula with enhanced fluid loss properties in High Pressure-High Temperature well condition containing pistachio shell powder. J Pet Sci Eng, 162, 378-385, |
| [19] | Agwu OE, Akpabio JU (2018) Using agro-waste materials as possible filter loss control agents in drilling muds. J Pet Sci Eng, 163: 185-198. |
| [20] | Adebayo TA, Chinonyere PC (2012) Sawdust as a filtration control and density additives in water-based drilling mud. Int J Sci Eng Res, 3(7): 176-204. |
| [21] | Amanullah M, Ramasamy J, Al-Arfaj MK (2016) Application of an indigenous eco-friendly raw material as fluid loss additive. J Pet Sci Eng, 139, 191-197. |
| [22] | Ghaderi S, Haddadi SA, Davoodi S, Arjmand M (2020) Application of sustainable saffron purple petals as an eco-friendly green additive for drilling fluids: A rheological, filtration, morphological, and corrosion inhibition study. J of Molecular Liquids, 315, 113707, |
| [23] | Davoodi S, Ramazani SAA, Rukavishnikov V, Minaev K (2021) Insights into application of acorn shell powder in drilling fluid as environmentally friendly additive: filtration and rheology. Int J Environ Sci Technol, 18, 835–848. |
| [24] | Ebrahimi MA, Sanati A (2022) On the potential of alyssum as an herbal fiber to improve the filtration and rheological characteristics of water-based drilling muds. Petroleum, 8(4): 509-515. |
| [25] | Boyi G, Amadi G (2023) Investigation into local additives as substitute to standard viscosifier. Advances in Drilling Technology. J Earth Energy Eng, 12(3), 114–120. |
| [26] | Ajiri O, Ayuba S, Obe A, Alade BO, Ibrahim KS, Gimba A (2024) Use of Sawdust and Coconut Fiber as Fluid Loss Control Additive for Water-Based Mud. Nile J Eng and Applied Sci, 2(1): 248-254. https://doi.org/10.5455/NJEAS.195229 |
| [27] | Ali JA, Abdalqadir M, Najat D, Hussein R, Jaf PT, Simo SM, Abdullah AD (2024) Application of ultra-fine particles of potato as eco-friendly green additives for drilling a borehole: A filtration, rheological and morphological evaluation. Chem Eng Res and Design, 206: 89-107, |
| [28] | Li M, Wu Q, Han J, Mei C, Lei T, Lee S, Gwon J (2020) Overcoming salt contamination of bentonite water-based drilling fluids with blended dual functionalized cellulose nanocrystals. ACS Sustainable Chem Eng, 8, 11569-11578. |
| [29] | Udoh FD, Okon AN (2012) Formulation of water-based drilling fluid using local materials. Asian J Microbio, Biotechnol Environ Sci, 14 (2): 167-174. |
| [30] | Rautela MS (2000) A method for determination of the permeability of the filter cake at wellsite. Society of Petroleum Engineers paper, SPE paper 50692. |
| [31] | Lomba R (2010) Fundamentos de Filtracaoe Controle das Propriedades de Filtracao. Report, 2010. |
| [32] | Chilingarian GV, Alp E, Caenn R, Al-Salem M, Uslu S, Gonzales S, Dorovi RJ, Mathur RM, Yen TF (1986) Drilling fluid evaluation using yield point-plastic viscosity correlation. Energy Sources, 8(2-3): 233-244. |
| [33] | Okon AN, Agwu OE, Akpabio MG (2015) Evaluation of a formulated synthetic-based mud properties on its cuttings carrying capacity using factorial design. Elixir Pet Eng J, 79: 30300-30303. |
| [34] | Agwu OE, Okon AN, Akpanika OI (2016) Activation of local bentonitic clay for use as viscosifiers in water-based drilling fluids. J Sci Res and Reports, 12(2): 1-11. |
| [35] | Ali I, Ahmed M, Ganat TA (2022) Experimental study on water-based mud: investigate rheological and filtration properties using Cupressus cones powder. J Pet Explor Prod Technol. |
| [36] | Veisi E, Hajipour M, Delijani EB (2020) Experimental study on thermal, rheological and filtration control characteristics of drilling fluids: effect of nanoadditives. Oil and Gas Sci Technol – Rev. IFP Energies nouvelles, 75 (36): 1-10. |
| [37] | Agwu OE, Akpabio JU, Archibong GW (2019) Rice husk and sawdust as filter loss control agents for water-based muds. Heliyon J, 5: 7. |
| [38] | Oseh JO, Norddin MNAM, Ismail I, Gbadamosi AO, Agi A, Mohammed HN (2019) A novel approach to enhance rheological and filtration properties of water-based mud using polypropylene–silica nanocomposite. J Pet Sci Eng, 181: 106264. |
| [39] | Kök MV, Bal B (2019) Effects of silica nanoparticles on the performance of water-based drilling fluids. J Pet Sci Eng, 180: 605-614. |
| [40] | Hassiba KJ, Amani M (2013) The effect of salinity on the rheological properties of water-based mud under high pressures high temperatures for drilling offshore and deep wells. J Earth Sci Res, 2(1): 175-186. |
| [41] | Sami NA (2016) Effect of magnesium salt contamination on the behaviour of drilling fluids. Egyptian J Pet, 25: 453-458. |
| [42] | Jarret MA, Guster B, Xiang T, Clapper D (2004) Improved competence in water activity measurement. Paper presented at the American Association of Drilling Engineers Technical Conference, Houston, Texas, USA, 6-7 April 2004. |
| [43] | Basirat B, Vipulanandan C, Richardson D (2013) Effect of salt contamination on the filtration loss in 4% bentonite drilling mud with xanthan gum. Paper presented at the Texas Hurricane Centre for Innovation Technology, Houston, Texas, USA. |
APA Style
Bassey, I. G., Okon, A. N., Igbafe, A. I., Essien, A. J. (2024). Assessing the Rheological and Filtration Loss Control Potential of Selected Plant-Based Additives in Oil-Based Mud. Petroleum Science and Engineering, 8(2), 100-124. https://doi.org/10.11648/j.pse.20240802.13
ACS Style
Bassey, I. G.; Okon, A. N.; Igbafe, A. I.; Essien, A. J. Assessing the Rheological and Filtration Loss Control Potential of Selected Plant-Based Additives in Oil-Based Mud. Pet. Sci. Eng. 2024, 8(2), 100-124. doi: 10.11648/j.pse.20240802.13
AMA Style
Bassey IG, Okon AN, Igbafe AI, Essien AJ. Assessing the Rheological and Filtration Loss Control Potential of Selected Plant-Based Additives in Oil-Based Mud. Pet Sci Eng. 2024;8(2):100-124. doi: 10.11648/j.pse.20240802.13
@article{10.11648/j.pse.20240802.13,
  author = {Idara George Bassey and Anietie Ndarake Okon and Anselm Iuebego Igbafe and Aniel Joshua Essien},
  title = {Assessing the Rheological and Filtration Loss Control Potential of Selected Plant-Based Additives in Oil-Based Mud
},
  journal = {Petroleum Science and Engineering},
  volume = {8},
  number = {2},
  pages = {100-124},
  doi = {10.11648/j.pse.20240802.13},
  url = {https://doi.org/10.11648/j.pse.20240802.13},
  eprint = {https://article.sciencepublishinggroup.com/pdf/10.11648.j.pse.20240802.13},
  abstract = {In drilling operations, chemical additives pose environmental concerns during mud disposal. This study evaluated three plant-based additives, namely rice husk (RH), Detarium microcarpum (DM), and Brachystegia eurycoma (BE), in oil-based mud at low-pressure, low-temperature conditions. The mud’s rheological profile followed Herschel Bulkley’s model. With 8 g additive content, RH increased the mud's apparent viscosity (AV), plastic viscosity (PV), and yield point (YP) by 62.5%, 51.25%, and 34.38%, respectively. DM showed higher increases of 200.0%, 195.0%, and 162.5%, while BE exhibited the most significant improvements of 287.5%, 272.5%, and 250.0%. The filtration tests indicated that RH reduced spurt loss and fluid loss volumes by 83.33% and 62.35%, while DM decreased by 82.41% and 47.94%, as BE had the highest reduction of 94.44% and 51.18%. Again, the filter cake thickness of RH, DM, and BE muds increased by 210.29%, 273.53%, and 79.41%, respectively, with permeabilities of 8.90×10⁻³ mD, 11.87×10⁻³ mD, and 7.35×10⁻³ mD. Furthermore, the mud susceptibility to NaCl showed that AV decreased for RH, DM, and BE, while YP decreased significantly. The filter cake thickness and permeability increased by 62.38 and 359.55% for RH, as the DM decreased by 93.80% and 84.37% and the BE by 96.68% and 96.62%, which indicates that RH is more susceptible to NaCl than DM and BE in the mud. Also, these plant-based additives in mud exhibited fragile gel strength and commendable cake characteristics: firm, smooth, and soft/slippery, which make them potentially suitable for oil well drilling.
},
 year = {2024}
}
TY  - JOUR
T1  - Assessing the Rheological and Filtration Loss Control Potential of Selected Plant-Based Additives in Oil-Based Mud

AU  - Idara George Bassey
AU  - Anietie Ndarake Okon
AU  - Anselm Iuebego Igbafe
AU  - Aniel Joshua Essien
Y1  - 2024/09/23
PY  - 2024
N1  - https://doi.org/10.11648/j.pse.20240802.13
DO  - 10.11648/j.pse.20240802.13
T2  - Petroleum Science and Engineering
JF  - Petroleum Science and Engineering
JO  - Petroleum Science and Engineering
SP  - 100
EP  - 124
PB  - Science Publishing Group
SN  - 2640-4516
UR  - https://doi.org/10.11648/j.pse.20240802.13
AB  - In drilling operations, chemical additives pose environmental concerns during mud disposal. This study evaluated three plant-based additives, namely rice husk (RH), Detarium microcarpum (DM), and Brachystegia eurycoma (BE), in oil-based mud at low-pressure, low-temperature conditions. The mud’s rheological profile followed Herschel Bulkley’s model. With 8 g additive content, RH increased the mud's apparent viscosity (AV), plastic viscosity (PV), and yield point (YP) by 62.5%, 51.25%, and 34.38%, respectively. DM showed higher increases of 200.0%, 195.0%, and 162.5%, while BE exhibited the most significant improvements of 287.5%, 272.5%, and 250.0%. The filtration tests indicated that RH reduced spurt loss and fluid loss volumes by 83.33% and 62.35%, while DM decreased by 82.41% and 47.94%, as BE had the highest reduction of 94.44% and 51.18%. Again, the filter cake thickness of RH, DM, and BE muds increased by 210.29%, 273.53%, and 79.41%, respectively, with permeabilities of 8.90×10⁻³ mD, 11.87×10⁻³ mD, and 7.35×10⁻³ mD. Furthermore, the mud susceptibility to NaCl showed that AV decreased for RH, DM, and BE, while YP decreased significantly. The filter cake thickness and permeability increased by 62.38 and 359.55% for RH, as the DM decreased by 93.80% and 84.37% and the BE by 96.68% and 96.62%, which indicates that RH is more susceptible to NaCl than DM and BE in the mud. Also, these plant-based additives in mud exhibited fragile gel strength and commendable cake characteristics: firm, smooth, and soft/slippery, which make them potentially suitable for oil well drilling.

VL  - 8
IS  - 2
ER  -
Department of Petroleum Engineering, University of Uyo, Uyo, Nigeria
Department of Petroleum Engineering, University of Uyo, Uyo, Nigeria
Department of Chemical and Petroleum Engineering, Afe Babalola University, Ado-Ekiti, Nigeria
Department of Petroleum Engineering, University of Uyo, Uyo, Nigeria
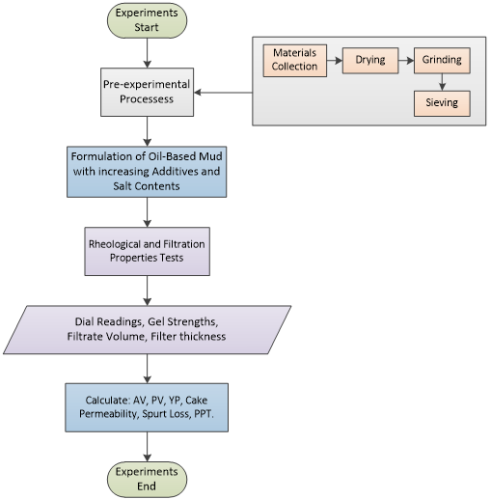
Figure 1. Flowchart of the experimental procedures of the study.
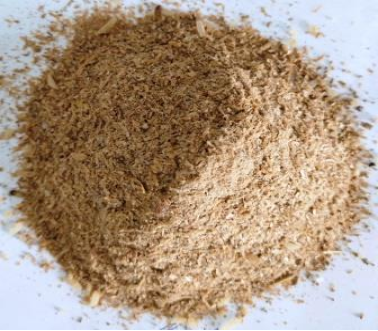
Figure 2. Rice husk.
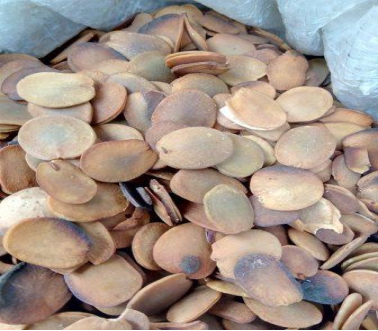
Figure 3. Brachystegia eurycoma.
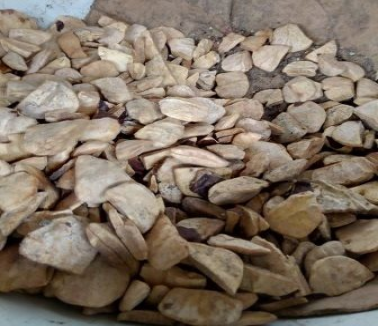
Figure 4. Detarium microcarpum.
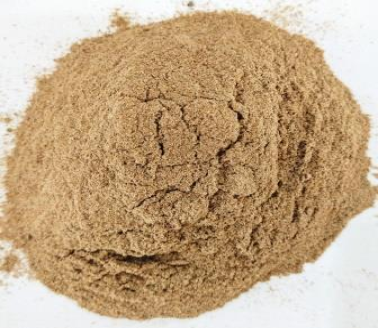
Figure 5. Ground Rice husk.
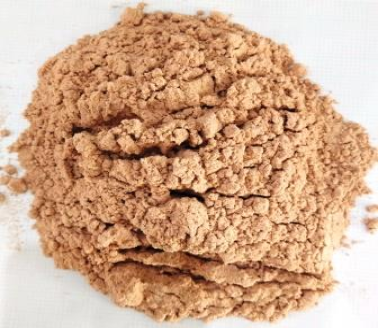
Figure 6. Ground Brachystegia eurycoma.
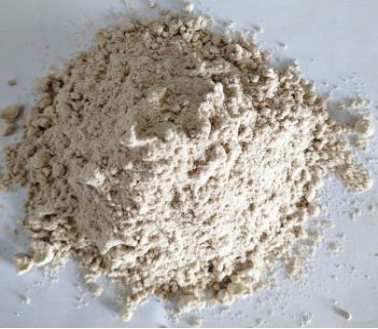
Figure 7. Ground Detarium microcarpum.
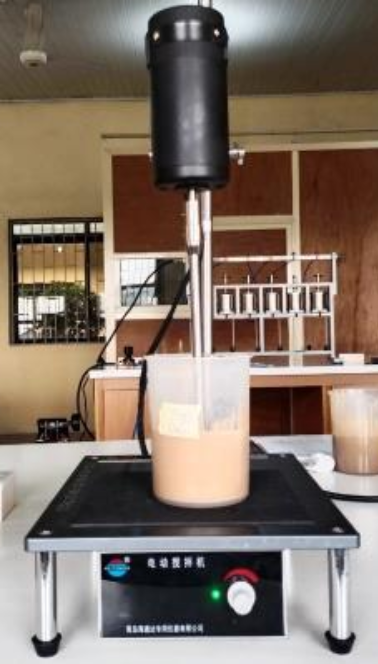
Figure 8. High-speed mud mixer.
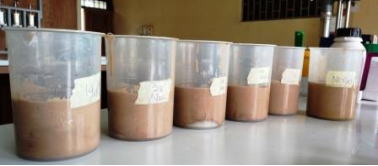
Figure 9. Some mud samples (side view).
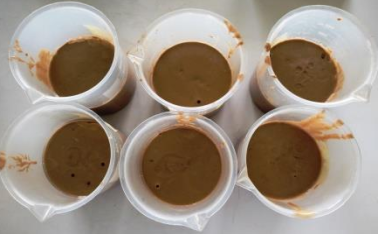
Figure 10. Some mud samples (plan view).
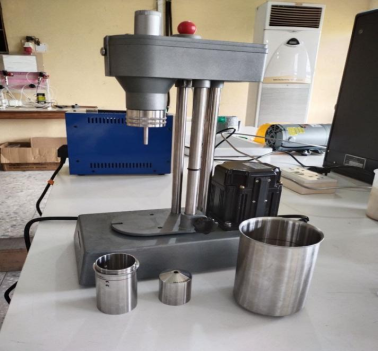
Figure 11. Fann V-G viscometer.
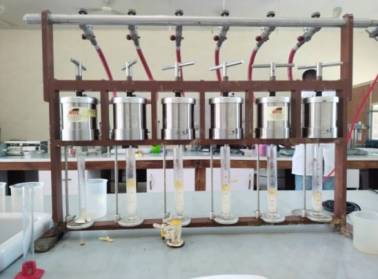
Figure 12. Ofite filter press stack.
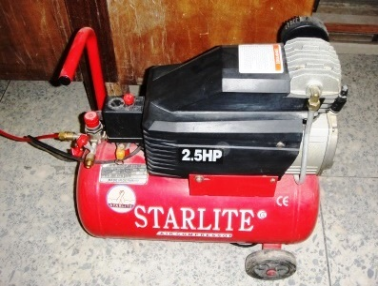
Figure 13. Air compressor pump.
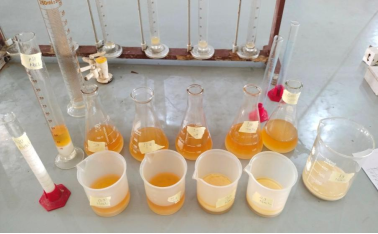
Figure 14. Some mud samples filtrate.
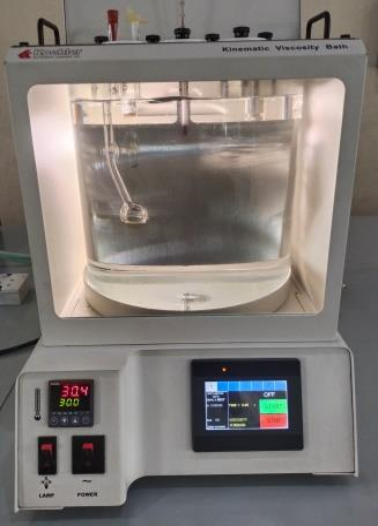
Figure 15. Kinematic viscosity bath.
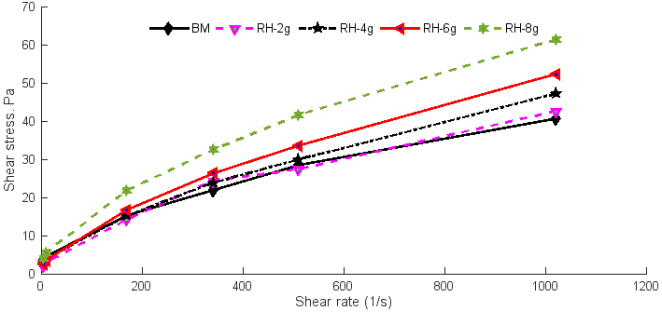
Figure 16. Shear stress-shear rate profile of the rice husk muds with the blank mud.
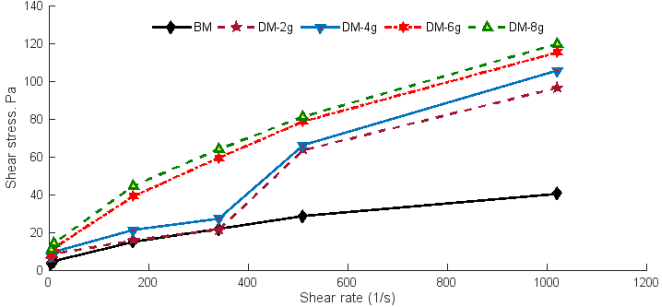
Figure 17. Shear stress-shear rate profile of the Detarium microcarpum muds with the blank mud.
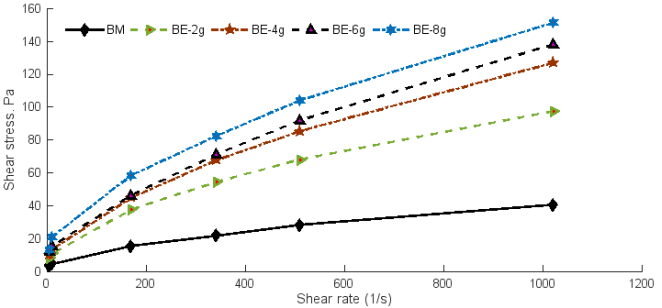
Figure 18. Shear stress-shear rate profile of the Brachystegia eurycoma muds with the blank mud.
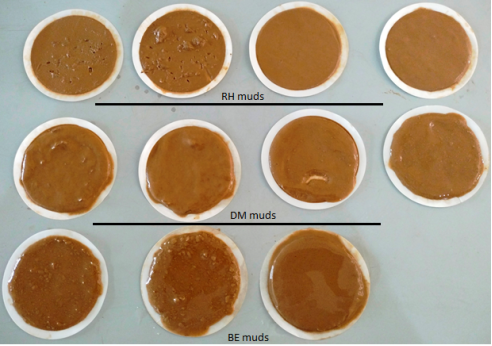
Figure 19. Some filter cakes obtained from the various mud samples.

Figure 20. Comparing the apparent viscosity of the 8 g additives muds with blank mud at varying salt concentrations.
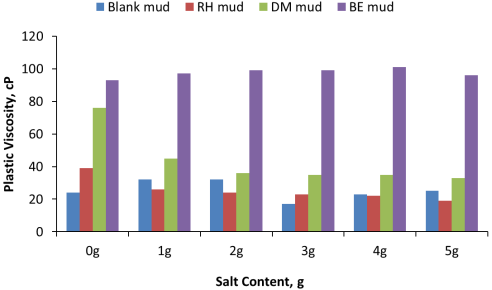
Figure 21. Comparing the plastic viscosity of the 8 g additives muds with blank mud at varying salt concentrations.
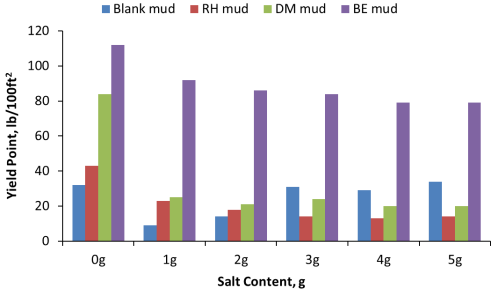
Figure 22. Comparing the yield point of the 8 g additives muds with the blank mud at varying salt concentrations.
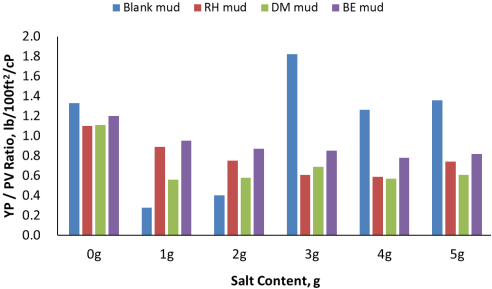
Figure 23. Comparing the YP/PV ratio of the 8 g additives muds with the blank mud at varying salt concentrations.
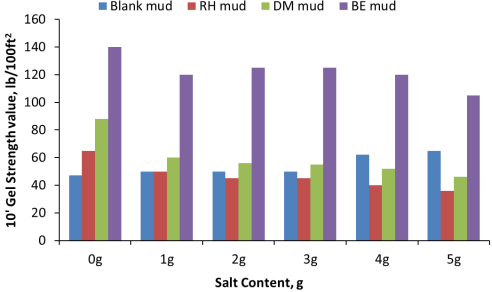
Figure 24. Comparing the 10-second gel strength of the 8 g additives muds with blank mud at varying salt concentrations.
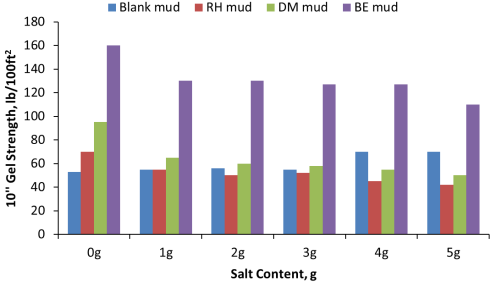
Figure 25. Comparing the 10-minute gel strength of the 8 g additives muds with blank mud at varying salt concentrations.
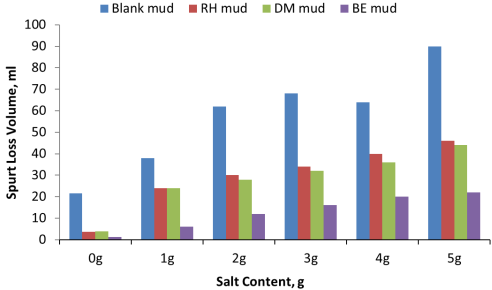
Figure 26. Comparing the spurt loss volume of the 8 g additives mud samples with the blank mud at varying salt concentrations.
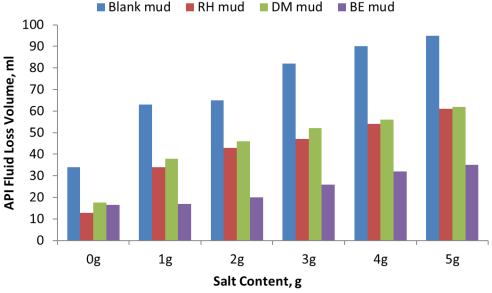
Figure 27. Comparing the API fluid loss volume of the 8 g additives mud samples with the blank mud at varying salt concentrations.
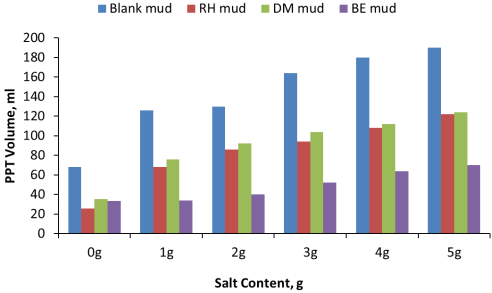
Figure 28. Comparing the permeability plugging test volume of the 8 g additives mud samples with the blank mud at varying salt concentrations.
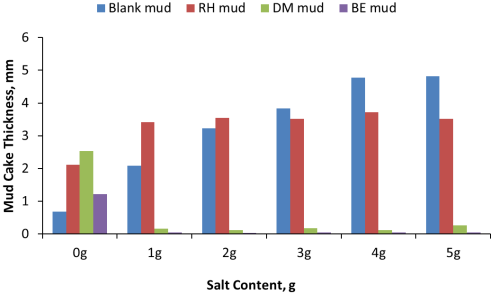
Figure 29. Comparing the mud cake thickness of the 8 g additives mud samples with the blank mud at varying salt concentrations.
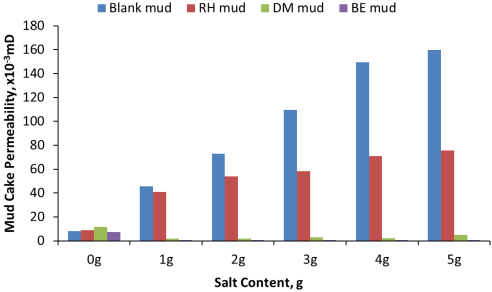
Figure 30. Comparing the mud cake permeability of the 8 g additives mud samples with the blank mud at varying salt concentrations.
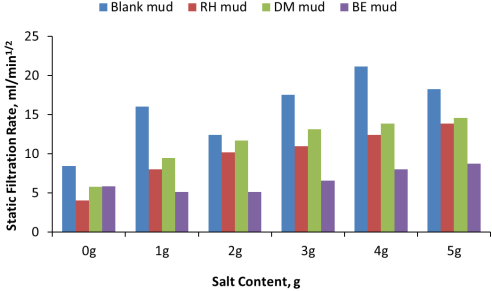
Figure 31. Comparing the static filtration rate of the 8 g additives mud samples with the blank mud at varying salt concentrations.
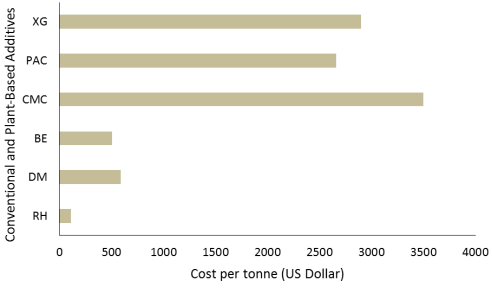
Figure 32. Cost comparison of the plant-based and conventional additives for rheological and filtration loss control in drilling mud.


 ,
, 