Abstract
Sand production occurs when oil and gas is produced alongside reservoir formations at some point in the productive lifecycle of a well, understanding why reservoir produces sand is a crucial step towards managing sand production, the objective of this research is to improve the quality of produced fluid (oil/gas) for easy separation, the study method of this research work was basically a laboratory based sieve analysis of formation sand of a well in consideration, this is designed to achieve the most effective gravel pack grain size to be used, from the result analyzed with careful interpretations as presented, the Niger Delta Well-X formation comprise grain sizes of 0.0788” – 0.0025” range as captured from the available set of sieves used, the concentration of percentage retain falls within grain size 0.0197” – 0.007 1” with 0.0197” having about 41.4% retain by weight with the total grain weight of 737grams to stand at 305grams, while grain size 0.0118” had a percentage retained of 25.5% having a weight of 188grams and 0.0071” had a percentage retain of 12.9% with a weight of 95% respectively, keeping all other size to be 20.1%, for the sorting, 9.4 was calculated from the analysis of this research which makes the gravel pack to be well sorted. Therefore, permeability and plugging challenges are not a problem. The range of gravel size recommended for the gravel pack was kept at a minimum of 0.0727” and a maximum of 0.1639”. A screen size of 55 gauges was calculated to enable effective gravel pack placement operation, which is practical solution to sand production for the well investigated if properly managed.
Keywords
Sand Production, Grain Size, Sieve Analysis, Screen Size, Gravel Pack
1. Introduction
Sandstone reservoirs has the most significant portion of the world's oil and gas deposits. Oil and gas producers find it lucrative to extract natural resources from these formations with high porosity and permeability. Sand production occurs in most of these formations at some time throughout their productive history, which is a drawback of using these highly transmissible reservoirs to produce gas and oil. Sand production in a well is determined by two factors: the production stresses generated by well fluids flowing through the formation matrix, and the restraining forces that hold the sandstone grains in place. Without taking any action for active sand management, many extremely unconsolidated deposits create sand during early production
| [1] | Michael J. Economides, A. Daniel Hill and Christine Ehlig Economides, 2009: Petroleum Production Systems, Practice Hall PTR, Upper Saddle River, New Jersey 07458. |
[1]
. Sand is produced by competent formations later in the production cycle for a variety of causes, including the compaction caused by overburden forces surpassing decreasing reservoir pressure or the influence of water production on the sand grain’s natural cementation. The amount of frictional force applied to the sand grains depends on the production rate, produced-fluid velocity, and produced-fluid viscosity. Solids are created when the pressures associated with production surpass the formation matrix's restraining forces. Shear, tensile, and volumetric failure lead the formation grains in weak sandstone reservoirs to disaggregate, or get separated from the rock matrix
| [2] | Nouri A, vaziri H and Islam R (2003); “A comprehensive Approach to Modeling Sanding During Oil Production,” paper SPE 81032, Presented at the SPE Latin American and Caribbean Petroleum Engineering Conference, Port-of-Spain, Trinidad, West Indies, April 23-30. https://doi.org/0.2118/81032-MS |
| [3] | Vaziri, H. (2012); “Determination of mobilized strength properties of degrading sandstone,” Journal of Soils and Foundations, vol. 52, no. 4, pp. 658–667. https://doi.org/10.1016/j.sandf.2012.07.007 |
[2, 3]
. Producing fluids does not mobilize all of the disaggregated sand grains
| [4] | Tiffin DL, Stein MH and Wang X (2003); Drawdown Guidelines for Sand Control Completions, “paper SPE 84495, presented at the SPE Annual Technical Conference and Exhibition, Dever, Colorado, USA, October 5-8. https://doi.org/10.2118/84495-MS |
[4]
. The strength of weak and unconsolidated rocks often diminishes as water saturation rises, with the most strength loss happening after a very small increase in water saturation from a dry condition
| [5] | Han G, Dusseault MB and Cook J (2002) “Quantifying Rock Capillary Strength Behaviour in Unconsolidated Sandstones, “ Paper SPE/ISRM 78170, presented at the SPE/ISRM Rock Mechanics Conference, Irving, Texas, USA. October 20-23. |
[5]
. Numerous strategies have been developed to use numerical models, analytical and empirical correlations, and physical model testing to anticipate or aid in understanding the problem of sand production
| [6] | Belheine N. J. P. Plassiard, F. V. Donzé, F. Darve, and A. Seridi, (2009); “Numerical simulation of drained triaxial test using 3D discrete element modeling,” Computers and Geotechnics, vol. 36, no. 1-2, pp. 320–331. http://dx.doi.org/10.1016/j.compgeo.2008.02.003 |
| [7] | Powers B. S., Edment, B., Elliott, F., Gilchrist, J., Twynam, A. J., and parper, M. (2006), A critical Review of Chirag Field Completions Performance Azerbaijan. Paper SPE 98146 presented at the international symposium and Exhibition on Formation Damage Control, Lafayette, USA, 15-17 Feb. https://doi.org/10.2118/98146-MS |
[6, 7]
. Routine laboratory testing can only forecast when sand production will begin
| [8] | Xiao Y and H. H. Vaziri (2011); “Import of strength degradation process in sand production prediction and management,” in Proceedings of the 45th U.S. Rock Mechanics/Geomechanics Symposium, San Francisco, Calif, USA. |
[8]
. Volumetric sand generation might be predicted using a more advanced physical model
| [9] | Papamichos E. P. Cerasi, J. F. Stenebråten et al., (2010); “Sand production rate under multiphase flow and water breakthrough,” in Proceedings of the 44th U.S. Rock Mechanics Symposium and the 5th US/Canada Rock Mechanics Symposium, Salt Lake City, Utah, USA. |
| [10] | Wang J, D. P. Yale, and G. R. Dasari (2011); “Numerical modeling of massive sand production,” in Proceedings of the SPE Annual Technical Conference and Exhibition, Denver, Colo, USA. https://doi.org/10.2118/147110-MS |
[9, 10]
. Gravel pack is essentially a downhole filter that is intended to stop the formation of undesirable sand. The formation sand is kept in place by appropriately sized gravel pack sand, which is then held in place by an appropriately sized screen
| [11] | Wagner, M., Webb, T., Maharaj, M., Twynam, A., Greene, T., Salamat, G., and parlar, M. (2006). Open-hole Horizontal Drilling and gravel packing with oil-based Fluids. An industry Milanese, SPE Drilling and Completion; 21(1): 32-43. SPE- 87648. PA. https://doi.org/10.2118/87648-MS |
| [12] | Rahmati H, A. Nouri, D. Chan, and H. Vaziri (2011); “Validation of predicted cumulative sand and sand rate against physical-model test,” Journal of Canadian Petroleum Technology, vol. 51, no. 5, pp. 403–410. https://doi.org/10.2118/157950-PA |
[11, 12]
.
2. Gravel Pack Placement
The annular area between the screen and the casing or formation must be entirely filled with gravel in order for the gravel pack to successfully complete. The gravel must also be next to the formation without having mingled with formation sand
| [13] | Ofoh, E. P., Wariboko, M., U waifo, F., and Parlar, M (2006). Openhole Gravel Packing with Oil-Based Fluids: Implemetation of the Lessons Learned from past Experiences Leads to the Best producer in Okpoho Field, Nigeria. Paper SPE 98151 presented at the international symposium and Exhibition on Formation Damage Control, Lafayette, Louisiana, USA, February. https://doi.org/10.2118/98151-MS |
[13]
. To achieve proper gravel placement, specialized tools and techniques have been created over time. In gravel pack operations, carrying fluids such as water or other low-viscosity liquids were initially employed. Low sand concentrations and high velocities were required since these fluids could not suspend the sand
| [14] | Hecter, M. T., Barry, M. D., and Martin, T. B (2004). Reducing Well cost by Gravel Packing in Non aqueous Fluid. Paper SPE 90758 presented at the SPE annual conference and Exhibition, Houston, 26-29 September. https://doi.org/10.2188/90758-MS |
| [15] | Ali, S., luyster, M., and Patel, A. (2006). Dual purpose Reversible reservoir drill-In Fluid provides the perfect solution for drilling and completion efficiency of a reservoir. Paper SPE 104110 presented at the SPE/IADC Indian Drilling Technology Conference and Exhibition, Mumbai, India, 16-18 October. https://doi.org/102118/104110-MS |
[14, 15]
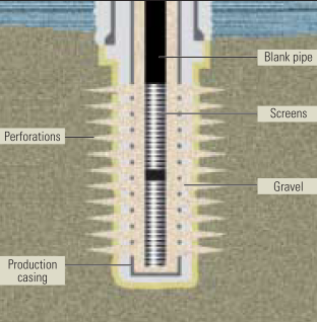
. Wellbore cleanout, sand-exclusion screen installation, and gravel packing were previously separate operations that were carried out following fracturing. Therefore, perforating optimization should be included in the casing-hole gravel-pack design. Perforation damage can be minimized by choosing the best perforating-gun system and perforating technique, as demonstrated in
figure 1 | [16] | Venkitaraman A, Behrmann LA and Chow CV (2002); “Perforating Requirements for Sand Control,” paper SPE 65187, presented at the SPE European petroleum Conference, paris, France, October 24-25. https://doi.org/10.2118/65187-MS |
[16]
.
2.1. Aim and Objective of the Study
The aim of this research work is to evaluate the effectiveness of gravel pack, using a typical formation sand in the Niger Delta and prepare same by sieve analysis for effective placement. The main objective is to control formation sand production alongside reservoir fluid and protect downhole equipment and improve the lifespan of a well. Others are; to improve the quality of the produced fluid (oil/gas) for easy separation and minimize damage of surface facilities.
2.2. Significance of the Study
The significance of this research cannot be over emphasized. However, gravel-packing involves inserting a metal screen into the wellbore and packing prepared gravel into the annulus around it with a size that blocks formation sand from passing through it. Therefore, data obtained from this study can be utilized to enhance gravel selection for gravel pack operation during well completion.
3. Methodology
The method applied in this research was basically a laboratory based sieve analysis of a well’s formation sand in the Niger Delta. The materials and equipment used in this study were a set of sieve, formation sand, sample can, source of electric current, 230-Volt electrical vibrating auto sieve shaker and receiver pan. This is designed to achieve the most effective gravel pack grain size to be used. The grain size of a gravel pack should be chosen such that, the particle size of the gravel pack depends upon the particle size distribution of the formation sand. The essence is to achieve the necessary conditions for a gravel pack, which are; sand free operation after development, highest permeability with stability (low resistance), low entrance velocities and efficient service life i.e. resistance to chemical attacks.
3.1. Particle Size Selection
The formation sand particle size distribution is obtained from the standard sieve analysis semi-log plot of cumulative weight percent (%) versus grain diameter in (inches) or particle size in (microns). Therefore, correlation of optimal gravel size was based on empirical formulas as presented
| [1] | Michael J. Economides, A. Daniel Hill and Christine Ehlig Economides, 2009: Petroleum Production Systems, Practice Hall PTR, Upper Saddle River, New Jersey 07458. |
[1]
, which depends on the uniformity of the formation but for most conditions of non-uniform sands the following formula was recommended and used:
Where is the recommended gravel size, is the diameter of formation sand for which 40 wt% of grains are of larger diameter. To fix gravel size distribution, Schwartz’s uniformity coefficient defined as
And it should be 1.5 or less from which we work with the following as gravel selection formulas
Where
and
are the minimum and maximum sizes of gravel to be used
| [1] | Michael J. Economides, A. Daniel Hill and Christine Ehlig Economides, 2009: Petroleum Production Systems, Practice Hall PTR, Upper Saddle River, New Jersey 07458. |
[1]
.
Where Dx: the size of particles such that x percent is larger i.e. (100 – x) percent passed, therefore D15 is 15% retained and 85% passed through that particular sieve size.
Therefore, the sand grains particle size distribution analysis (SGPSDA) was made using a set of sieve with different aperture or sizes as shown in
Table 1.
Table 1. Different Sizes of Sieves.
S/N | APERTURE (SIZE OF SIEVE OPENING) | WEIGHT OF SIEVE (GRAMS) |
1 | 2 (mm) | 109 |
2 | 1 (mm) | 103 |
3 | 500 (micron) | 95 |
4 | 300 (micron) | 82 |
5 | 180 (micron) | 79 |
6 | 106 (micron) | 69 |
7 | 63 (micron) | 64 |
3.2. Experimental Procedure
Weigh the empty cans and record the weights, add the formation sand particles from a well into the sample can & note the weight. Then Oven-dry the wet formation sand particles for 24hrs to enable moisture content to be removed and be ready to do proper sieve analysis. Thereafter, determine the weight of different sizes of sieve and record it on a separate table. Place back the different sizes of sieve in their orderly manner as it was arranged; (i.e. in descending order with the sieve with largest aperture or sieve openings taking the top most sieve tray. Then place the oven-dried formation sand particles into the top sieve with the largest aperture, cover the sieve with its cover and connect the electrical vibrating auto sieve shaker to power source and switch on the socket. Observe the process as grains sizes are differentiated with various sieve openings and the well sorted formation fines (powder-like grains) settle on the container at the bottom of the last sieve or mesh. The sieve trays where measured again to obtain the weight of the sand retained in individual sieve trays. This weight was gotten by a simple arithmetic calculation as shown below.
Weightofsievewithsandretainedemptyweightofsieve=weighofweightofsandretained.(5)
This process was monitored with accurate precaution until all samples were sieved completely and results recorded accurately. Then the percentage retained was obtained from another simple arithmetic equation as follows;
Percentageretain(6)
This cumulative weight percent is now plotted against mesh sizes or sieve openings (sieve sizes) on a semi-log paper for analysis. After results recorded, data analysis of graphical plots and other calculation were done to make necessary interpretations.
4. Results and Discussion
From the laboratory analysis made, different results were obtained. This section encompasses presentation of results and the various interpretations that were reached.
4.1. Results Presentation
One oil-well samples in the Niger Delta were studied and analyzed in this research for effective gravel packing. A total of 737grams of formation sand was used for the well laboratory sieve analysis; these sand samples were obtained from sidewall cores of the productive intervals of well-X in the Niger Delta Basin located about 103km from Niger Delta University approximately.
4.1.1. Results of Sieve Analysis
The laboratory results obtained from the sieve analysis is presented in
table 2 below.
Table 2. Results of Sieve Analysis for Well-X.
S/N | APERTURE (SIZE SIEVE OPENING) | SIEVE SIZES (INCHES) | WEIGHT OF SIEVE (GRAMS) | WEIGHT OF MESH + SAND (GRAMS) | WEIGHT OF SAND RETAINED (GRAMS) | PERCENTAGE RETAINED (%) | CUMULATIVE PERCENTAGE RETAINED (%) |
1 | 2 (mm) | 0.0788 | 109 | 135 | 26 | 3.527815468 | 3.527815468 |
2 | 1 (mm) | 0.0394 | 103 | 152 | 49 | 6.648575305 | 10.17639077 |
3 | 500 (micron) | 0.0197 | 95 | 400 | 305 | 41.38398915 | 51.56037992 |
4 | 300 (micron) | 0.0118 | 82 | 270 | 188 | 25.50881954 | 77.06919946 |
5 | 180 (micron) | 0.0071 | 79 | 174 | 95 | 12.89009498 | 89.95929444 |
6 | 106 (micron) | 0.0042 | 69 | 112 | 43 | 5.834464043 | 95.79375848 |
7 | 63 (micron) | 0.0025 | 64 | 95 | 31 | 4.20624152 | 100 |
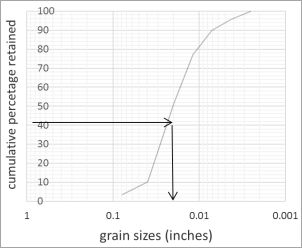
From the results presented in the above
table 2 of the sieve analysis, a semi-log plot of cumulative percent retained versus sieve sizes or grain size was prepared as presented in
figure 2 below.
Figure 2. A plot of cumulative percent retained against grain sizes for Well-X in Niger Delta.
4.1.2. Results of Grain Size Analysis for Well-X
The correlation of optimal gravel size for pack design was based on Schwartz
| [18] | D. H. Schwartz, “Successful sand control design for high rate oil and water wells,” in Society of Petroleum Engineers, 2013. |
[18]
and Saucier
| [19] | R. J. Saucier, “Considerations in gravel pack design,” in Society of Petroleum Engineers, 2013. |
[19]
empirical formulas as presented
| [1] | Michael J. Economides, A. Daniel Hill and Christine Ehlig Economides, 2009: Petroleum Production Systems, Practice Hall PTR, Upper Saddle River, New Jersey 07458. |
[1]
, which depends on the uniformity of the formation and was calculated using equation (
1) as follows:
Schwartz (1969);
From the above plot (
Figure 2) D
f 40 = 0.0197”
Therefore the recommended gravel size will be;
This is approximately 3mm or 3000 microns
(8)
For saucier (1974) 6 x 50% intercept gives gravel that will not allow invasion of grains into pack. This implies;
(9)
From the plot above, the 50% intercept grain size is approximately 0.0197”.
This means, the recommended gravel size for packing is:
(10)
To fix gravel size distribution, Schwartz’s uniformity coefficient
was calculated using equation (
2) as shown below;
=0.5(11)
This result is within the limits recommended, but our minimum and maximum gravel sizes to be used were given in equation (
3) and (
4). These equations were used to calculate for the minimum and maximum gravel size recommendable.
(12)
(13)
When converted into millimetre and microns, the minimum recommendable gravel size for effective gravel packing will be 1.85mm or 1850 microns. While the maximum recommendable gravel size for an effective gravel packing will be 4.16mm or 4150microns.
4.2. Interpretation of Results
From the result so far presented in this section, critical analysis was made and the following interpretations were reached.
4.2.1. Recommended Gravel Size for Packing
From the calculations of recommended gravel size for effective gravel packing, the best recommendable gravel size for effective pack design based on the sieve analysis of the sample in use will be in a range from 0.0727” to 0.1639” for the Well-X investigated. This in microns will be 1850 to 4150 micron. But this will be better considered when the sorting of the formation grain size are also taken into consideration. For sorting consideration, the following calculations were used;
From the sieve analysis plot, the D10 corresponds to 0.0394”and our D95 corresponds to 0.0042. The sorting of the formation is therefore given at 9.4% for the aforementioned Well-X, which is well sorted. This simply means that, there will be effective permeability after gravel packing with the recommended range of gravel sizes and the completion maybe a screen only or a gravel packed but preferably screen and gravel pack together for a more productive well life.
For open or cased holes with the requirement of screens, an appropriate screen selection is a criterion that must be inculcated in the effective gravel placement technique and design. This is necessary in order to achieve efficient production life of the well with coming to servicing for damage of improper completion related problems. Because screens are placed after gravel packs towards the annulus of production (i.e., hole), appropriate screen gauge selection to prevent selected gravel for packing to be produced is very important. If this is not taken into consideration, the whole completion work done will be useless. Conventionally, slot size stops gravel (inches or gauge) and to get the appropriate slot size or gauge, it was recommended that 50% to 75% of the smallest gravel size in range be considered for more effective result
| [17] | Gillespie, G., Deem, C. K., and Malbrel, C. (2000). Screen selection for sand control based on laboratory tests. Presented at the SPE Asia Pacific Oil and Gas Conference and Exhibition, 16-18 October, Brisbane, Australia. SPE 64398-MS. https://doi.org/10.2118/64398-MS |
[17]
. From the gravel size range above, the minimum gravel size recommend was 0.0727 inches and 75% of this is;
0.75×0.0727=0.055”or55gauge.
This is the recommended screen size that will disallow gravel used for packing to be produced or eroded.
5. Conclusions
Sand production is a major concern to the oil and gas industry due to the damage it cause on both downhole and surface equipment. This work has demonstrated the very importance of sieve analysis as the basic instrument from which all evaluations for gravel sizing is beckoned which in itself is the father of all other evaluations, pertaining to gravel pack operations such as size selection to sorting calculations, screen sizing, hydraulic structure designs, etc. Effective gravel pack placement is a function of proper laboratory sieve analysis design to empirically select appropriate gravel size for pack placement that will be devoid of post completion production challenges such as plugging, erosion, undesirable sand production, permeability, etc. With proper gravel pack placement technique design with sieve grain size analysis, production challenges such as those mentioned above will be minimized. However, for further research, it is advised that gravel pack design and laboratory sieve analysis for effective gravel packing should be carried out to even the close-set well in the same location in an oilfield. This is highly recommended because it was observed in the laboratory sieve analysis that; no powder-like fine particles was seen at the receiver can at the bottom of the set of sieve during sieving. This implies that sand production differs from well to well in an oilfield. Therefore, for effective gravel pack planning, a well must undergo proper laboratory sieve analysis to select filter pack.
Abbreviations
Dx: Size of Particles Such That X% is Larger
Dg,min: Minimum Size of Gravel
Dg,max: Maximum Size of Gravel
Uc: Uniformity Coeficient
D10: Formation Sand Diameter, 10 Percentile
D15: Formation Sand Diameter, 15 Percentile
D40: Formation Sand Diameter, 40 Percentile
D50: Median Grain Size of the Gravel-Pack Sand, 50 Percentile
D90: Formation Sand Diameter, 90 Percentile
D: Gravel Diameter
Acknowledgments
I want to sincerely thank my supervisor, Prof. Dulu Appah, for all his patience and support during this research. Also, my gratitude is extended to all the lecturers in the department of petroleum engineering, Niger Delta University, especially the former head of department, Dr. (Mrs) Rhoda H. Gumus and all other lecturers who contributed to the successful completion of this program. My appreciation goes to all my former colleagues for their encouragement and helpful criticism.
Author Contributions
Indighe Macdonald: Conceptualization, Data curation, Formal Analysis, Investigation, Methodology, Project administration, Validation, Visualization, Writing – original draft, Writing – review & editing
Elvis Ogede Adimie: Data curation, Formal Analysis, Funding acquisition, Project administration, Resources, Software, Supervision, Writing – review & editing
Conflicts of Interest
The authors declare no conflicts of Interest.
References
| [1] |
Michael J. Economides, A. Daniel Hill and Christine Ehlig Economides, 2009: Petroleum Production Systems, Practice Hall PTR, Upper Saddle River, New Jersey 07458.
|
| [2] |
Nouri A, vaziri H and Islam R (2003); “A comprehensive Approach to Modeling Sanding During Oil Production,” paper SPE 81032, Presented at the SPE Latin American and Caribbean Petroleum Engineering Conference, Port-of-Spain, Trinidad, West Indies, April 23-30.
https://doi.org/0.2118/81032-MS
|
| [3] |
Vaziri, H. (2012); “Determination of mobilized strength properties of degrading sandstone,” Journal of Soils and Foundations, vol. 52, no. 4, pp. 658–667.
https://doi.org/10.1016/j.sandf.2012.07.007
|
| [4] |
Tiffin DL, Stein MH and Wang X (2003); Drawdown Guidelines for Sand Control Completions, “paper SPE 84495, presented at the SPE Annual Technical Conference and Exhibition, Dever, Colorado, USA, October 5-8.
https://doi.org/10.2118/84495-MS
|
| [5] |
Han G, Dusseault MB and Cook J (2002) “Quantifying Rock Capillary Strength Behaviour in Unconsolidated Sandstones, “ Paper SPE/ISRM 78170, presented at the SPE/ISRM Rock Mechanics Conference, Irving, Texas, USA. October 20-23.
|
| [6] |
Belheine N. J. P. Plassiard, F. V. Donzé, F. Darve, and A. Seridi, (2009); “Numerical simulation of drained triaxial test using 3D discrete element modeling,” Computers and Geotechnics, vol. 36, no. 1-2, pp. 320–331.
http://dx.doi.org/10.1016/j.compgeo.2008.02.003
|
| [7] |
Powers B. S., Edment, B., Elliott, F., Gilchrist, J., Twynam, A. J., and parper, M. (2006), A critical Review of Chirag Field Completions Performance Azerbaijan. Paper SPE 98146 presented at the international symposium and Exhibition on Formation Damage Control, Lafayette, USA, 15-17 Feb.
https://doi.org/10.2118/98146-MS
|
| [8] |
Xiao Y and H. H. Vaziri (2011); “Import of strength degradation process in sand production prediction and management,” in Proceedings of the 45th U.S. Rock Mechanics/Geomechanics Symposium, San Francisco, Calif, USA.
|
| [9] |
Papamichos E. P. Cerasi, J. F. Stenebråten et al., (2010); “Sand production rate under multiphase flow and water breakthrough,” in Proceedings of the 44th U.S. Rock Mechanics Symposium and the 5th US/Canada Rock Mechanics Symposium, Salt Lake City, Utah, USA.
|
| [10] |
Wang J, D. P. Yale, and G. R. Dasari (2011); “Numerical modeling of massive sand production,” in Proceedings of the SPE Annual Technical Conference and Exhibition, Denver, Colo, USA.
https://doi.org/10.2118/147110-MS
|
| [11] |
Wagner, M., Webb, T., Maharaj, M., Twynam, A., Greene, T., Salamat, G., and parlar, M. (2006). Open-hole Horizontal Drilling and gravel packing with oil-based Fluids. An industry Milanese, SPE Drilling and Completion; 21(1): 32-43. SPE- 87648. PA.
https://doi.org/10.2118/87648-MS
|
| [12] |
Rahmati H, A. Nouri, D. Chan, and H. Vaziri (2011); “Validation of predicted cumulative sand and sand rate against physical-model test,” Journal of Canadian Petroleum Technology, vol. 51, no. 5, pp. 403–410.
https://doi.org/10.2118/157950-PA
|
| [13] |
Ofoh, E. P., Wariboko, M., U waifo, F., and Parlar, M (2006). Openhole Gravel Packing with Oil-Based Fluids: Implemetation of the Lessons Learned from past Experiences Leads to the Best producer in Okpoho Field, Nigeria. Paper SPE 98151 presented at the international symposium and Exhibition on Formation Damage Control, Lafayette, Louisiana, USA, February.
https://doi.org/10.2118/98151-MS
|
| [14] |
Hecter, M. T., Barry, M. D., and Martin, T. B (2004). Reducing Well cost by Gravel Packing in Non aqueous Fluid. Paper SPE 90758 presented at the SPE annual conference and Exhibition, Houston, 26-29 September.
https://doi.org/10.2188/90758-MS
|
| [15] |
Ali, S., luyster, M., and Patel, A. (2006). Dual purpose Reversible reservoir drill-In Fluid provides the perfect solution for drilling and completion efficiency of a reservoir. Paper SPE 104110 presented at the SPE/IADC Indian Drilling Technology Conference and Exhibition, Mumbai, India, 16-18 October.
https://doi.org/102118/104110-MS
|
| [16] |
Venkitaraman A, Behrmann LA and Chow CV (2002); “Perforating Requirements for Sand Control,” paper SPE 65187, presented at the SPE European petroleum Conference, paris, France, October 24-25.
https://doi.org/10.2118/65187-MS
|
| [17] |
Gillespie, G., Deem, C. K., and Malbrel, C. (2000). Screen selection for sand control based on laboratory tests. Presented at the SPE Asia Pacific Oil and Gas Conference and Exhibition, 16-18 October, Brisbane, Australia. SPE 64398-MS.
https://doi.org/10.2118/64398-MS
|
| [18] |
D. H. Schwartz, “Successful sand control design for high rate oil and water wells,” in Society of Petroleum Engineers, 2013.
|
| [19] |
R. J. Saucier, “Considerations in gravel pack design,” in Society of Petroleum Engineers, 2013.
|
Cite This Article
-
-
@article{10.11648/j.pse.20240801.17,
  author = {Indighe Macdonald and Elvis Ogede Adimie},
  title = {Effective Gravel Pack Technique for Well Completion
},
  journal = {Petroleum Science and Engineering},
  volume = {8},
  number = {1},
  pages = {56-62},
  doi = {10.11648/j.pse.20240801.17},
  url = {https://doi.org/10.11648/j.pse.20240801.17},
  eprint = {https://article.sciencepublishinggroup.com/pdf/10.11648.j.pse.20240801.17},
  abstract = {Sand production occurs when oil and gas is produced alongside reservoir formations at some point in the productive lifecycle of a well, understanding why reservoir produces sand is a crucial step towards managing sand production, the objective of this research is to improve the quality of produced fluid (oil/gas) for easy separation, the study method of this research work was basically a laboratory based sieve analysis of formation sand of a well in consideration, this is designed to achieve the most effective gravel pack grain size to be used, from the result analyzed with careful interpretations as presented, the Niger Delta Well-X formation comprise grain sizes of 0.0788” – 0.0025” range as captured from the available set of sieves used, the concentration of percentage retain falls within grain size 0.0197” – 0.007 1” with 0.0197” having about 41.4% retain by weight with the total grain weight of 737grams to stand at 305grams, while grain size 0.0118” had a percentage retained of 25.5% having a weight of 188grams and 0.0071” had a percentage retain of 12.9% with a weight of 95% respectively, keeping all other size to be 20.1%, for the sorting, 9.4 was calculated from the analysis of this research which makes the gravel pack to be well sorted. Therefore, permeability and plugging challenges are not a problem. The range of gravel size recommended for the gravel pack was kept at a minimum of 0.0727” and a maximum of 0.1639”. A screen size of 55 gauges was calculated to enable effective gravel pack placement operation, which is practical solution to sand production for the well investigated if properly managed.
},
 year = {2024}
}
 Copy
|
Copy
|
 Download
-
TY  - JOUR
T1  - Effective Gravel Pack Technique for Well Completion

AU  - Indighe Macdonald
AU  - Elvis Ogede Adimie
Y1  - 2024/05/17
PY  - 2024
N1  - https://doi.org/10.11648/j.pse.20240801.17
DO  - 10.11648/j.pse.20240801.17
T2  - Petroleum Science and Engineering
JF  - Petroleum Science and Engineering
JO  - Petroleum Science and Engineering
SP  - 56
EP  - 62
PB  - Science Publishing Group
SN  - 2640-4516
UR  - https://doi.org/10.11648/j.pse.20240801.17
AB  - Sand production occurs when oil and gas is produced alongside reservoir formations at some point in the productive lifecycle of a well, understanding why reservoir produces sand is a crucial step towards managing sand production, the objective of this research is to improve the quality of produced fluid (oil/gas) for easy separation, the study method of this research work was basically a laboratory based sieve analysis of formation sand of a well in consideration, this is designed to achieve the most effective gravel pack grain size to be used, from the result analyzed with careful interpretations as presented, the Niger Delta Well-X formation comprise grain sizes of 0.0788” – 0.0025” range as captured from the available set of sieves used, the concentration of percentage retain falls within grain size 0.0197” – 0.007 1” with 0.0197” having about 41.4% retain by weight with the total grain weight of 737grams to stand at 305grams, while grain size 0.0118” had a percentage retained of 25.5% having a weight of 188grams and 0.0071” had a percentage retain of 12.9% with a weight of 95% respectively, keeping all other size to be 20.1%, for the sorting, 9.4 was calculated from the analysis of this research which makes the gravel pack to be well sorted. Therefore, permeability and plugging challenges are not a problem. The range of gravel size recommended for the gravel pack was kept at a minimum of 0.0727” and a maximum of 0.1639”. A screen size of 55 gauges was calculated to enable effective gravel pack placement operation, which is practical solution to sand production for the well investigated if properly managed.

VL  - 8
IS  - 1
ER  -
Copy
|
Download