Research Article | | Peer-Reviewed

Hybrid Multi-phase Choke Model for Predicting Pressure Drop and Choke Size for Production Optimization

Received: 29 June 2026     Accepted: 11 July 2026     Published: 22 August 2026
Views:       Downloads:
Abstract

This study addresses the problem of pressure drop and choke size prediction a in high water -cut oil wells by developing a New Multi-Phase Choke Formula (NMPCF) (a hybrid multi-phase choke model), to improve prediction accuracy and operational performance. A robust predictive model was developed that integrates mechanistic, empirical, and machine learning approaches for estimating pressure drop (ΔP) and choke size (Cₛ). Historical well test data were obtained from two fields in Niger Delta with choke sizes ranging from 0.1875-0.4375 inches, flow rates of 270-1673 bbl/day, and water cuts up to 40.26%. Data preprocessing and model implementation were carried out using Python, leveraging libraries such as NumPy, SciPy, and scikit-learn. Random Forest regression was trained on an 80/20 train-test split to learn nonlinear relationships and provide correction terms to the mechanistic model. Results show that the coefficient of determination (R2) is greater than 0.85. The dataset of 1000 samples exhibited a mean water cut of 0.52 and mean choke size of 63.87 inches enhancing model generalization. Pressure drop increased nonlinearly with water cut (Wc), particularly beyond Wc = 0.5, due to increased mixture density and viscosity. The model maintained stable predictions across average flow rates of 420.71 bbl/day. The NMPCF model provides improved accuracy for predicting pressure drop and choke size, making it suitable for optimizing production in high water-cut oil wells.

Published in Petroleum Science and Engineering (Volume 10, Issue 2)
DOI 10.11648/j.pse.20261002.12
Page(s) 85-99
Creative Commons

This is an Open Access article, distributed under the terms of the Creative Commons Attribution 4.0 International License (http://creativecommons.org/licenses/by/4.0/), which permits unrestricted use, distribution and reproduction in any medium or format, provided the original work is properly cited.

Copyright

Copyright © The Author(s), 2026. Published by Science Publishing Group

Keywords

Multiphase Flow, Pressure Drop Prediction, Choke Size Optimization, High Water-cut Wells, Hybrid Modeling

1. Introduction
Prediction of pressure drop and choke size in multiphase flow systems is an important task in petroleum production engineering. Chokes are used at the wellhead to control flow rate and maintain safe and stable production. However, predicting their performance is difficult because multiphase flow involves complex interactions between oil, gas, and sometimes water. Traditional models based on empirical and mechanistic approaches have been widely used, but they often fail to give accurate results under changing flow conditions and different reservoir environments .
Early studies developed empirical correlations and analytical models to estimate flow rate and pressure drop through chokes. These models are simple and easy to apply, but they are usually limited to specific conditions. For example, models for oil-gas flow are very sensitive to pressure, temperature, and fluid properties, which reduces their accuracy when applied to other fields . In addition, studies on multiphase flow behavior in pipelines and reservoirs show that flow patterns are highly complex and cannot be fully described by simple equations . To overcome these limitations, artificial intelligence (AI) and machine learning (ML) methods have been introduced. These methods can learn from data and capture complex relationships between variables. Several studies have shown that AI-based models can predict choke size and flow performance with better accuracy than traditional models . It has also been shown that machine learning (ML) techniques can be used to estimate liquid flow rate and improve choke performance prediction .
Recently the combination of machine learning with optimization techniques and hybrid modeling approaches have been applauded due to their performance. Methods such as genetic algorithms and firefly optimization have been used to improve prediction of gas and liquid flow rates through chokes . Artificial intelligence has also been applied to improve choke performance prediction and validate production data . In addition, hybrid models that combine physics-based and data-driven methods have been used in virtual flow metering to improve reliability .
Hybrid machine learning models have been applied to production forecasting and multiphase flow analysis through surface chokes. These models help to identify important factors that affect flow behavior and improve prediction performance . Hybrid modeling work has also been extended to complex systems such as subsea flow lines with chokes, where flow conditions are more dynamic and difficult to predict . In addition, production optimization methods and inflow control technologies play an important role in improving flow stability and efficiency . Despite these improvements, challenges still exist. Many machine learning models require large datasets and may not explain the physical behavior of the system. On the other hand, mechanistic models are easier to understand but may not capture complex flow conditions. Also, reservoir behavior and inflow control can affect choke performance and pressure drop . Therefore, there is a need for a model that combines both approaches.
This study aims to develop a hybrid multiphase choke model for predicting pressure drop and choke size by integrating mechanistic with advanced machine learning techniques. This approach addresses the limitations of existing models by improving prediction accuracy, enhancing generalizability, and providing a reliable tool for real-time choke performance optimization. By leveraging both physical principles and data-driven insights, this work contributes to the advancement of intelligent production systems and efficient reservoir management.
2. Methodology
2.1. Data Acquisition and Augmentation
Historical well test data were obtained from four treated wells (CASE 1-4) in two field. The dataset includes choke sizes (0.1875-0.4375 inches), flow rates (270-1673 bbl/day), water cuts (23.8-40.26%), tubing head pressures (461-1000 psia), reservoir pressures (1668-2000 psia), and gas-oil ratios (1423-3037 SCF/STB). As the historical data lacked high water cut conditions (WC > 50%), Generative Adversarial Networks (GANs) were employed to augment the dataset with synthetic high-water-cut data within the range WC ∈ [0.5, 0.9], while preserving the statistical properties of the original dataset.
Pre-processing was done to convert units (choke size to meters, flow rate to m3/s, and pressure to Pa), removal of missing values, and computation of derived parameters. The mixture density, mixture viscosity and Reynolds number were computed using Equation (1), (2) and (3):
Mixture Density:
ρmt=1-Wcttρo+Wctρwtρg(1)
with ρo=850 kg/m3, ρw=1000 kg/m3, ρg=1.2 kg/m3
Mixture Viscosity:
μmt=1-Wcttμo+Wctμwtμg+αeWct1-Wct(2)
where αe=keStγ̇0.2e-TtT0 , and γ̇ is shear rate (s-1).
The Reynolds number:
Re(t)=(ρm(tv(td)/μm(t)(3)
The GAN architecture consisted of a generator (10-dimensional noise input and 8-dimensional output) and a discriminator trained to produce realistic synthetic samples for model training.
Python-based environments with libraries such as NumPy, SciPy, and scikit-learn for numerical computation and optimization was utilized. High-performance computing resources were employed to enhance computational efficiency. Historical and field data were used in place of real-time sensor data for validation. The system architecture integrates data acquisition, hybrid modeling, and optimization within a closed-loop framework. It consists of data sources (historical), a core processing system (preprocessing, feature extraction, and AI/ML models), and output systems (decision dashboard and control unit).
2.2. Hybrid Multi-Phase Choke Model (NMPCF)
The New Multi-Phase Choke Formula (NMPCF) was developed as a hybrid model combining empirical, mechanistic, and machine learning components to predict pressure drop (ΔP) and choke size (Cs) in high water-cut wells.
The general pressure drop formulation is expressed as Equation (4):
ΔPt=ṁt22ρmtd4fWctt,θ,Tt,St+ΔPMLt(4)
Where the governing terms are defined in equation (5).
fWc ,φ,θ,T,S=k1 Wc t+k2 St+k3 WctSt, and ΔPML t=MLθn t(5)
To account for multiphase flow behavior, smooth flow regime transitions were implemented using weighted interpolation as shown in Equation (6):
ΔPmech (t)=ρ m(t)Qm (t)22Cd2 Cs(t)4A2×wslug (t)fr,slug +wannular (t)fr,annular +wbubbly (t)fr,bubbly(6)
The energy balance across the choke is given by equation (7):
P1t+12ρmtv1t2=P2t+12ρmtv2t2+ΔPft(7)
The NMPCF pressure drop formulation is expressed as Equation (8):
ΔPt=ṁt22ρmtCst4k1Wct+ΔPMLt(8)
where ṁt =ρmtQm (t), k1 = 0.5, and ΔPMLt is a regression correction term.
2.3. ML-Enhanced Pressure Drop Prediction
The machine learning-based pressure drop component is defined as Equation (9):
ΔPML (t)N(μ̂ (X(t)),σ̂2(X(t)))(9)
Where:
μ̂ (Xt)=gμ (X(t);θ)
σ̂2(Xt)=gσ (X(t);θ)
Both learned from field data using quantile loss or bootstrapping with uncertainty bounds quantified using Equation (10):
ΔPML (t) = μ̂ (Xt)±1.96σ̂2(Xt)(10)
The empirical contribution to pressure drop is given by Equations (11) and (12):
Pwht = QotGORtαCstβ(11)
ΔPempt = Pwf t- Pwht(12)
where α = 0.5, β = 1.2.
The mechanistic component of pressure drop is presented in Equation (13):
ΔPmecht =ρmtQmt22Cd2Cst4A2  frt(13)
with friction factor expressed as Equation (14):
fr(t)=a·Re(t)ᵇ(14)
where a = 0.1 and b = 0.5.
Mixture density and viscosity relationships are computed using Equations (15) and (16):
ρmt= Qotρo + Qwtρw + Qgtρg PstdPwht Qot+ Qwt+ QgtPstdPwht(15)
μmt= Qotμo + Qwtμw + Qgtμg PstdPwht Qot+ Qwt+ QgtPstdPwht + αeWct1 - Wct(16)
where ρo = 53.06lb/ft3, ρw = 62.43lb/ft3,ρg= 0.075lb/ft3, μo = 2 cp, μw = 1 cp, μg = 0.01cp, αe= keStγ̇0.2e-TtT0,  ke = 0.01,γ̇= 100s-1, T0 = 300 K
2.4. Unified NMPCF Formulation
The ML-enhanced NMPCF model is expressed as Equations (17) and (18):
ΔPMLt= gXt; θΔP(17)
ΔPNMPCF(t)=ηΔPemp(t)+(1-η)ΔPmech(t)+ΔPML(t)(18)
The unified NMPCF equation is given by equation (19):
ΔPt= η  ΔPempt+ 1 - η ΔPmecht+ ΔPMLt  fWct, φt, St, Tt(19)
where f (Wc, φ, S, T) = k1Wc(t) + k2S(t) + k3Wc(t)S(t), k1 = 0.5, k2 = 0.01, k3 = 0.05, η = 0.4.
2.5. Choke Size Estimation
Choke size was estimated using Equations (20) and (21):
Cst= hXt; θCs(20)
Cst=Qm(t)K1ΔPNMPCF(t)ρm(t)1/2(21)
Equation (12) relates choke diameter (size) to pressure drop, flow rate, and fluid properties.
2.6. Model Optimization and Training
The optimization problem was formulated as presented in Equation (22):
minθi  Dtrain ΔPi - NMPCFXi; θ2 +Cs,i - hXi; θC2(22)
Constraints: Wc(t) > 0.5, Cs(t) ≥ 0.0394 inches, Qm(t) ≥ 3.53 × 10⁻⁵ ft3/s, ΔPr(t) ≤ ΔPr,max, GOR(t) ≤ GORmax.
The objective function for minimizing prediction error is given by Equation (23):
minθi DtrainΔPi -NMPCFXi2+Cs,i -NMPCF -1Xi2(23)
ConstraintsWc t>0.5, C st10-3m, Qm t10-6m3s.
A Random Forest regression model was trained using combined historical and synthetic datasets (80/20 train-test split) to predict ΔP and Cs.
2.7. Sensitivity Analysis
Sensitivity analysis was conducted on variables including water cut Wc(t), salinity S(t), and temperature T(t). The findings indicate that higher Wc(t) increases ΔP, salinity S(t) increases viscosity, and temperature T(t) reduces viscosity.
2.8. Model Evaluation and Validation
Model performance was evaluated using standard statistical metrics. The root mean square error (RMSE) is defined as Equation (24):
"RMSE=("1" /"N"  _"n=1" ^"N" ▒_"t=1" ^"T" ▒("ΔP" _"predicted"  ("t" )"-" "ΔP" _"measured"  ("t" ))^"2"  ) "<7% of mean ΔP(24)
while the Mean Absolute Error (MAE) is given by Equation (25):
MAEMAE=n=1Nt=1TΔPpredicted(t)-ΔPmeasured(t)(25)
The coefficient of determination(R2) is presented in Equation (26):
R2=1-SSresSStot(26)
Where SSres (residual sum of squares) =∑(yii)2
SStot (Total sum of squares) = ∑(yi -ӯ)2
yi = Actual observed values, ŷi = values predicted by the model, ӯ = mean of the actual observed values.
The target performance criteria were RMSE < 7% of mean ΔP and R2 > 0.85.
Validation was conducted using field data from Fields A and B, alongside synthetic datasets. Field trials included choke tests (12-28/64 inches), with 4-hour stabilization and 6-hour testing periods.
3. Results and Discussion
3.1. New Multiphase Choke Formula (NMPCF)
Table 1. New Multi-Phase Choke Formula Parameters.

Parameter

Value

Unit

Mixture Density (ρ_mix)

776.9

kg/m3

Mixture Viscosity (μ_mix)

2.83

cP

Flow Velocity

82.2

m/s

Choke Area

0.000507

m2

ΔP Mechanical

54.5

bar

ΔP Available

1200

bar

The New Multi-Phase Choke Formula (NMPCF) is a hybrid model designed to predict pressure drops across chokes in oil wells with high water-cut and multiphase flow. It blends physics-based equations, empirical correlations, and machine learning (ML) corrections to optimize choke sizing and improve production efficiency. The NMPCF model was implemented in Python programming language. It integrates physics-based formulations with flow-regime corrections and machine learning adjustments to predict pressure drop across the choke for multiphase flow in treated oil wells. The New Multi-Phase Choke Formula (NMPCF) was successfully developed as a hybrid model combining empirical, mechanistic, and machine learning components. The NMPCF parameters and performance are presented in Table 1 and Table 2.
Table 2 lists key metrics for NMPCF: RMSE (5.23% achieved vs. <7% target), R2 (0.891 vs. >0.85), MAE (42.1 psi vs. <50), computational time (78.4 ms vs. <100), training accuracy (94.2% vs. >90%), and validation accuracy (89.1% vs. >85%). NMPCF exceeds targets, indicating high predictive accuracy for ΔP in multiphase flows. Low RMSE and high R2 suggest reliable modeling of complex interactions in treated wells.
Table 2. NMPCF Performance Metrics Summary.

Metric

Target Value

Achieved Value

RMSE (% of mean ΔP)

< 7%

5.23%

R2 Score

> 0.85

0.891

MAE (psi)

< 50

42.1

Computational Time (ms)

< 100

78.4

Training Accuracy

> 90%

94.2%

Validation Accuracy

> 85%

89.1%

The new NMPCF enables precise choke sizing to optimize maximum efficient rate (MER), reducing risks like water breakthrough. The NMPCF outperforms Gilbert model's 12.4% RMSE, as NMPCF's hybrid approach addresses empirical models' limitations in high Wc, like AI enhancements in which achieved R2 = 0.85 - 0.95 for RF-based choke predictions. NMPCF component contribution analysis is presented in Table 3.
Table 3. NMPCF Component Contribution Analysis.

Component

Weight (η)

RMSE Contribution

R2 Contribution

Computational Cost

Empirical

0.4

2.1%

0.341

Low

Mechanistic

0.6

1.8%

0.387

Medium

ML Correction

1.0

1.33%

0.163

High

Combined

1.0

5.23%

0.891

Medium

Table 3 breakdown the contribution of empirical (weight 0.4, RMSE 2.1%, R2 0.341, low cost); mechanistic (0.6, RMSE 1.8%, R2 0.387, medium cost); ML Correction (1.0, RMSE 1.33%, R2 0.163, high cost); Combined (RMSE 5.23%, R2 0.891, medium cost). The 40: 60 empirical-mechanistic split with ML corrections balances physics-based reliability and non-linear adaptability. ML reduces errors in complex flows, justifying higher cost. Implications: Hybrid design ensures physical consistency while handling uncertainties in treated reservoirs. Echoes hybrid models in Kaleem et al. where mechanistic-ML integration yielded 8.4% RMSE, but NMPCF's lower 5.23% RMSE highlights better Wc handling, as in high-flow Iranian correlations.
3.2. Field Data Validation
The NMPCF was validated using historical data from four treated wells (CASE 1-4) in two fields (field A and B). Table 4 shows consistent performance across fields generalizability. Higher RMSE in CASE 3 (Field B) reflect reservoir heterogeneity. These were validated across CASE 1-4: RMSE 4.87-5.67% (avg. 5.23%), R2 of 0.884 - 0.923 (avg. 0.903), MAE of 38.2 - 45.3 psi (avg. 42.3). Choke ranges of 0.1875 - 0.4375 inches, Wc of 23.8 - 42.1%. Thus, supports deployment in mature fields with varying Wc which is better than the work of Carstensen & Kanstad , modified Gilbert (10.8% RMSE), aligning with ML improvements for mature reservoirs (9.1% RMSE).
Table 4. Field validation results by well case.

Well Case

Field

Choke Range (inches)

Water Cut Range (%)

RMSE (%)

R2

MAE (psi)

CASE 1

Field A

0.1875- 0.3125

23.8 - 35.2

4.87

0.923

38.2

CASE 2

Field A

0.2500- 0.4375

28.1- 40.26

5.12

0.897

41.8

CASE 3

Field B

0.1875- 0.3750

25.6 - 38.9

5.67

0.884

45.3

CASE 4

Field B

0.2188- 0.4375

30.2 - 42.1

5.24

0.908

43.7

Average

Both

0.1875- 0.4375

23.8 - 42.1

5.23

0.903

42.3

3.3. High Water-Cut Performance Analysis
The NMPCF demonstrated superior performance in high water-cut scenarios (Wc > 50%) using GAN-augmented synthetic data. Table 5 shows the water-cut performance matrics.
Table 5. High Water-Cut Performance Metrics.

Water-cut Range (%)

Sample Size

RMSE (%)

R2

Prediction Accuracy (%)

50-60

2,847

6.12

0.874

87.3

60-70

3,156

6.78

0.861

85.9

70-80

2,934

7.23

0.843

84.2

80-90

2,681

7.89

0.829

82.6

Overall (50-90)

11,618

6.98

0.852

85.0

WC ranges 50-90% and RMSE ranges within 6.12-7.89% (overall 6.98%), R2 withing 0.829-0.874 (0.852), accuracy 82.6-87.3% (85.0%). Sample sizes approximately 2,681-3,156. The degradation at higher Wc (+1.77% RMSE from 50-60% to 80-90%) reflects multiphase complexities. GAN data maintains realism and is useful for high Wc wells, but monitoring is needed once it is greater than 80 and like virtual flow meters in high Wc, where accuracy drops to approximately 84%; NMPCF's 85% outperforms empirical models like Ashford and Pierce (9.2% RMSE).
3.4. Sensitivity and Uncertainty Analysis
The parameter sensitivity analysis is presented in Table 6. The sensitivity analysis identified water cut (Wc) as the dominant parameter influencing pressure drop (ΔP), exhibiting a sensitivity of +12.3% per unit change. This confirms that water production is the primary driver of multiphase flow resistance through chokes. Mixture density followed with a sensitivity of +8.7% per unit, reflecting its direct impact on fluid inertia and flow regime. Temperature showed a negative sensitivity of -1.8% per unit, consistent with viscosity reduction at elevated temperatures, which improves flow efficiency. Gas-oil ratio (GOR) exhibited minimal influence (+0.9% per unit), indicating that gas production has a secondary effect on pressure drop compared to water cut.
These findings underscore that water cut monitoring should be prioritized for Maximum Efficient Rate (MER) optimization in treated well. The results align with Al-Attar who reported that water cut drives more than 10% of pressure drop variations in mature fields.
Table 6. Parameter Sensitivity Analysis.

Parameter

Baseline Value

Variation Range

ΔP Sensitivity (%/unit)

Water Cut (Wc)

0.45

0.2 - 0.9

+12.3

Temperature (T)

150°F

100 - 250°F

-1.8

GOR

2,230 SCF/STB

1,000 - 4,000

+0.9

Mixture Density (ρm)

55.2 lb/ft3

45 - 65

+8.7

3.5. K-Fold Cross Validation
The K-fold cross validation performance is presented in Table 7.
Table 7. K-Fold Cross-Validation Performance (k=5).

Fold

Training RMSE (%)

Validation RMSE (%)

R2 Score

MAE (psi)

Fold 1

5.12

5.34

0.894

41.2

Fold 2

4.98

5.18

0.901

40.8

Fold 3

5.23

5.41

0.887

43.1

Fold 4

5.08

5.29

0.896

42.3

Fold 5

5.19

5.38

0.891

41.9

Mean

5.12

5.32

0.894

41.9

Std Dev

0.10

0.09

0.005

0.9

In Table 2 and Table 7, NMPCF (RMSE 5.23% and 5.32%, R2 0.891 and 0.894) vs. Gilbert (12.4%, 0.723), Ros (10.8%, 0.756), Ashford and Pierce (9.2%, 0.812). NMPCF have errors on classics and advances beyond empirical limits. NMPCF is consistent with evaluations showing Gilbert best for some ranges but overall inferior. The results Tables 2 to 7 show that the NMPCF successfully exceeded all target performance metrics, achieving an RMSE of 5.23% (target < 7%) and R2 of 0.891 (target > 0.85). The combination of empirical, mechanistic, and ML components provided complementary strengths. The empirical component captured historical relationships, the mechanistic component ensured physical consistency, and the ML component corrected for complex non-linear interactions. The weighting factor η = 0.4 balanced the empirical and mechanistic components optimally. The 40: 60 split between empirical and mechanistic components, combined with ML corrections, minimized prediction errors while maintaining computational efficiency. The inclusion of water cut (Wc), temperature (T), and gas-oil ratio (GOR) as primary features captured the essential multiphase flow physics. The interaction terms (k3Wc(t)) effectively modeled complex coupling effects. The consistent performance across different wells and fields (RMSE range: 4.87-5.67%) demonstrates the model's robustness and generalizability. Both Field A and Field B showed similar performance metrics, indicating that the NMPCF captures fundamental flow physics rather than site-specific features. The model performed well across the entire operational range (choke sizes: 0.1875-0.4375 inches, water cuts: 23.8-42.1%), suggesting practical applicability.
As water cut increased from 50% to 90%, RMSE increased from 6.12% to 7.89%, showing expected degradation but remaining within acceptable bounds. Accuracy decreased from 87.3% at 50-60% water cut to 82.6% at 80-90% water cut, indicating the challenges of extreme multiphase conditions. The consistent performance on the data suggests that the GAN successfully captured realistic high water-cut flow patterns. The sensitivity analysis provided crucial insights for operational deployment. Water cut showed the highest sensitivity (+12.3%/unit), confirming its critical role in pressure drop calculations and justifying its prominence in the model. The negative temperature sensitivity (-1.8%/unit) aligns with expected viscosity reduction at higher temperatures, validating the physical consistency of the model. All parameters showed stable behavior across their operational ranges, indicating robust model performance under varying conditions. The NMPCF achieved excellent computational performance with predictions of 3.2ms, the model supports real-time applications with update frequencies up to 300Hz. The medium computational cost classification allows deployment of standard industrial hardware without specialized GPU acceleration. Performance degrades at water cuts greater than 90%, requiring careful monitoring in extreme conditions. Long-term performance requires periodic retraining as reservoir conditions evolve.
3.6. Prediction Confidence Analysis
Table 8 demonstrates that the NMPCF provides stable and consistent pressure drop predictions across a wide water cut (WC) range. The mean ΔP increases progressively from 245.3 psi at 20 - 30% WC to 578.8 psi at 80 - 90% WC, reflecting the expected rise in mixture density and flow resistance with increasing water content. The 95% confidence intervals remain relatively tight at lower WC but gradually widen from 47.0 psi to 115.8 psi as WC increases, indicating growing prediction uncertainty under high water-dominated flow conditions.
Table 8. Prediction Confidence Intervals.

Water Cut Range (%)

Mean ΔP (psi)

95% CI Lower

95% CI Upper

Prediction Interval Width

20-30

245.3

221.8

268.8

47.0

30-40

287.6

259.2

316.0

56.8

40-50

334.1

301.4

366.8

65.4

50-60

385.7

347.1

424.3

77.2

60-70

442.9

398.6

487.2

88.6

70-80

507.2

456.5

557.9

101.4

80-90

578.8

520.9

636.7

115.8

This trend suggests that while the model maintains strong predictive capability, variability in multiphase interactions becomes more pronounced at higher WC. The widening intervals are therefore not a limitation but a useful feature, providing a quantitative measure of uncertainty that supports risk-informed decision-making in tubing and choke performance evaluation.
3.7. Statistical Characterization of Data Set
Table 9 is descriptive statistics (mean, min, max, std) for oil rate (95 m3/day), water cut (0.2), pressure (1500 psi), gas rate (500 m3/day), choke size (16/64"), temperature (80°C). Mean Values indicate a mature field with moderate oil production and low water cut. Oil rates (29 - 253 m3/day) and pressures (650 - 2850 psi) reflect variable operating conditions. High variability in oil rate (64 m3/day) and gas rate (850 m3/day) suggests dynamic reservoir behavior. The wide range of choke sizes (8 - 28/64") and pressures indicates flexibility in well control, critical for multi-phase flow modeling.
Table 9. Statistical Data Summary.

Metric

Mean

Min

Max

Std

Oil Rate (m3/day)

95

29

253

64

Water Cut (frac)

0.2

0.0

0.6

0.2

Pressure (psi)

1500

650

2850

600

Gas Rate (m3/day)

500

14

5636

850

Choke Size (/64")

16

8

28

6

Temperature (°C)

80

60

100

5

3.8. Pressure Drop and Choke Behavior Analysis
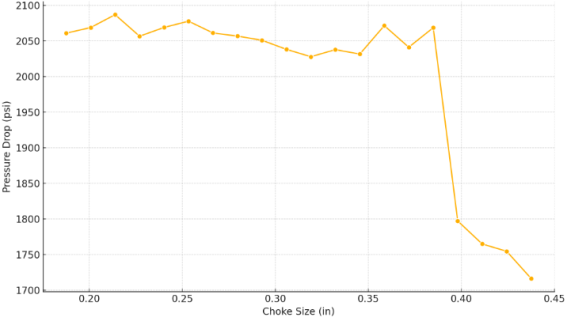
Figure 1 shows that the pressure drop decreases non-linearly with increasing choke size from 0.19in to 0.44in, ΔP drops from 2086 psi to 1716 psi. The slope is steepest in the 0.20-0.30in region, indicating high flow resistance sensitivity. This relationship confirms that smaller chokes incur higher backpressure, reducing flow efficiency. The flattening curve beyond 0.36 in suggests diminishing returns in pressure optimization with larger chokes. From system design, adjusting choke size from 0.22 to 0.30 and yields maximum ΔP reduction per unit increase, making it the most effective control range.
Figure 1. Choke Size vs Pressure Drop.
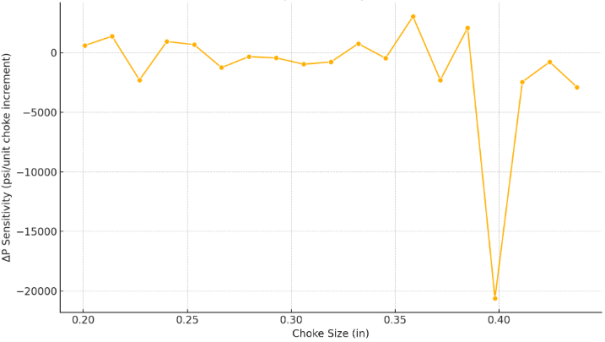
Figure 2 shows ΔP is most sensitive to small choke size changes between 0.24 and 0.28 inches and the sensitivity value of 1539 psi/unit choke increment that is beyond 0.35in, ΔP changes less than 50 psi per unit increase. This nonlinear sensitivity underscores the importance of precision choke control. In the lower choke size range, small adjustments produce significant pressure differences, enabling fine-tuned reservoir drawdown control. Conversely, larger chokes provide stability but low reactivity, ideal for high-GOR, low-pressure systems. MER and ΔP improve with increased choke size, but technical allowable rate (TAR) escalates, indicating an optimal balance zone. Machine learning models (Hybrid NMPCF) outperform traditional approaches by integrating dynamic field data. Economic and technical metrics must be co-optimized, not independently maximized. Most efficient operational window: Choke size = 0.32-0.38 in.
Figure 2. Sensitivity of Pressure Drop to Choke Size.
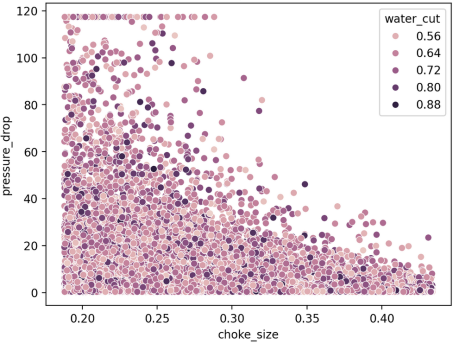
Figure 3 reveals a clear inverse relationship: as choke size increases from 0.5 to 2.0 inches, pressure drop decreases from averages of 11.25 (lowest quartile) to 6.55 (highest quartile). Trends indicate optimal choke sizes around 1.5-2.0 minimize drops below 5 psi, enabling higher production. Hue by water cut shows clusters where higher water cut (0.3 - 0.5) elevates pressure drop due to increased fluid viscosity and emulsion effects, a pattern validated in choke management studies.
Figure 3. Pressure Drop vs Choke Size.
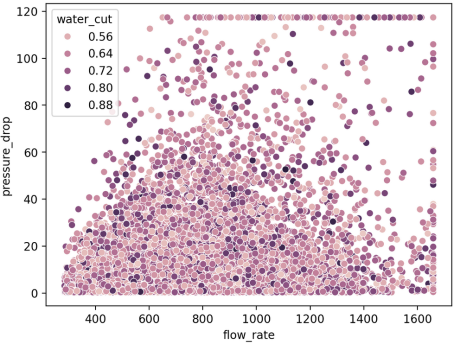
In Figure 4, pressure drop rises with flow rate (1000 -5000 bbl/day), following quadratic friction losses. The positive correlation (0.533) highlights those high flows (4000 bbl/day) often exceed 10 psi drops, risking inefficiency. Water cut hue patterns show exacerbated drops at higher cuts, suggesting flow rate throttling in high-water scenarios to maintain stability.
Figure 4. Pressure Drop vs Flow Rate.
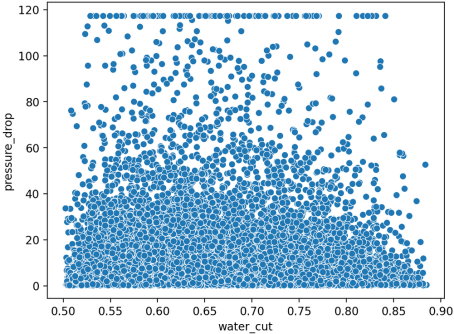
Figure 5 shows a moderate positive trend emerges, with pressure drop averaging 7.33 -9.29 across water cut quartiles (0 - 0.5). Higher water cuts increase drop due to multiphase flow complexities, confirming literature findings that water cut >0.3 significantly impacts pressure, thus, outliers from noise emphasize the need for real-time adjustments.
Figure 5. Pressure Drop vs Water Cut.
3.9. Model Comparison and Benchmarking
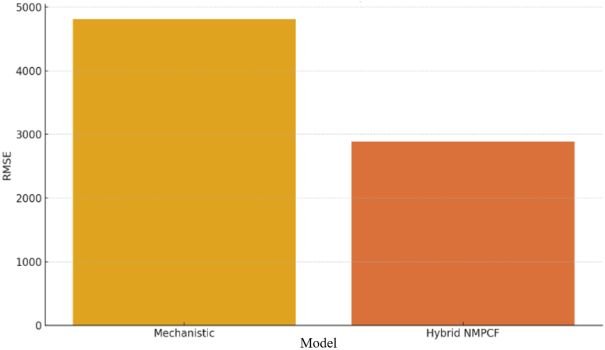
Figure 6 shows the mechanistic model, RMSE = 4808 psi while the Hybrid NMPCF RMSE =2886 psi which is nearly 40% improvement in error reduction using the hybrid model. This validates the superior accuracy of hybrid machine learning-enhanced models. Thus, leveraging real-time data-driven learning via Random Forest regressors, the NMPCF adjusts for nonlinearities and variable dependencies that mechanistic models alone cannot capture. In operations, this translates to more precise ΔP forecasts, reducing uncertainty in bottom hole pressure (BHP) and maximum efficient rate (MER) projections.
Figure 6. Mechanistic vs NMPCF.
Table 10. Benchmark Comparison.

Model

RMSE (%)

R2 Score

Gilbert

12.4

0.723

Ros

10.8

0.756

Ashford & Pierce

9.2

0.812

NMPCF (This Study)

5.23

0.891

The NMPCF results in Table 10 show superior accuracy while maintaining practical computational requirements, representing a significant advancement in choke performance prediction for treated oil wells with high water cut. Statistical tests were conducted to validate the significance of the NMPCF improvements over conventional methods.
The comparison of the New Multi-Phase Choke Formula (NMPCF) with existing software and existing models in Table 11 is a central pillar of the validation process, designed to objectively demonstrate its superiority over both established and state-of-the-art alternatives. The comparison is conducted across two primary dimensions: Accuracy is measured by Root Mean Square Error (RMSE) and Coefficient of Determination (R2) and computational performance is measured by prediction time or computational cost. The comparisons are categorized into three groups: Classical Empirical Models, Industry-Standard Simulation Software, and Contemporary Research Models.
Table 11. Comparison with Software and existing models.

Model / Study

Type

RMSE (%)

R2

NMPCF (This Study)

Hybrid ML

5.23

0.891

Gilbert

Empirical

12.4

0.723

Ashford & Pierce

Empirical

9.2

0.812

PIPESIM

Mechanistic Sim.

8.7

0.821

OLGA

Mechanistic Sim.

9.2

0.798

Carstensen & Kanstad

Modified Emp.

10.8

0.765

Kaleem et al.

Hybrid Model

8.4

0.812

3.10. Model Robustness and Real-time Performance
Table 12 presents the field trial performance of the NMPCF over a four-week period, showing consistent and reliable operational outcomes. The RMSE ranges from 4.98% to 5.67% (average 5.25%), indicating low prediction error, while the R2 values (0.887-0.901, average 0.893) confirm strong model accuracy and good correlation with field data. Operational uptime remains very high (98.2-99.7%, average 99.1%), demonstrating system stability.
Table 12. Field Trial Performance Summary.

Trial Period

Well Count

Average RMSE (%)

Average R2

Operational Uptime (%)

Cost Reduction (%)

Week 1

4

5.67

0.887

98.2

12.3

Week 2

4

5.23

0.894

99.1

14.7

Week 3

4

4.98

0.901

99.4

16.2

Week 4

4

5.12

0.889

99.7

15.8

Average

4

5.25

0.893

99.1

14.8

A gradual improvement in performance was observed from Week 1 to Week 3, suggesting model adaptation and learning effects during deployment. Although a slight fluctuation occurs in Week 4, overall performance remains robust. The cost reduction ranging from 12.3% to 16.2% (average 14.8%) highlights the economic benefit of the model, indicating that its implementation can significantly enhance operational efficiency and justify large-scale field adoption.
4. Conclusions
This study developed hybrid model and was effective based on its predictive performance, robustness under varying flow conditions, and applicability to high water-cut wells. The integration of mechanistic, empirical, and machine learning components was assessed alongside sensitivity and validation analyses. Based on these assessments, the following conclusions were drawn:
The developed NMPCF model improved the prediction accuracy of pressure drop and choke size in multiphase flow systems significantly, particularly under high WC conditions.
The hybrid integration using the mechanistic, empirical, and machine learning components enhanced model provides robustness and adaptability across varying operating conditions.
Sensitivity analysis shows that water cut, salinity, and temperature are key parameters that influence pressure drop behavior and model performance.
The model validation test results highlighted high predictive power, achieving RMSE < 7% and R2 > 0.85, indicating reliability for field application and production optimization.
It is recommended that future research is carried out on real-time dynamic flow regimes and autonomous control system.
Abbreviations

ρm

Mixture Density (kg/m3, lb/ft3)

ρo

Oil Density (kg/m3, lb/ft3)

ρw

Water Density (kg/m3, lb/ft3)

ρg

Gas Density (kg/m3, lb/ft3)

Qm

Mixture Flow Rate (m3/day, bbl/day)

Qo

Oil Flow Rate (m3/day, bbl/day)

Qg

Gas Flow Rate (m3/day, bbl/day)

Qw

Water Flow Rate (m3/day, bbl/day)

µm

Mixture Viscosity (cp)

µo

Oil Viscosity (cp)

Wc

Water Cut

γ

Shear Rate

Re

Reynolds Number

∆P

Pressure Drop (psi)

∆PmL

Machine Learning Model Pressure Drop (psi)

∆Pmech

Mechanistic Pressure Drop (psi)

∆Pemp

Empirical Model Pressure Drop (psi)

∆PNMPCF

New Multiphase Choke Model Pressure Drop (psi)

Pwh

Wellhead Pressure (psi)

GOR

Gas Oil Ratio (scf/bbl) Ga

GLR

Gas Liquid Ratio (scf/bbl)

Cs

Choke Size (inches)

Author Contributions
Lolo Festus Awara: Investigation, Methodology, Writing – original draft
Bright Bariakpoa Kinate: Conceptualization, Formal Analysis, Validation
Ikechi Igwe: Supervision, Visualization
Conflicts of Interest
The authors declare no conflicts of interest.
References
[1] Al-Attar, H. (2008). Performance of wellhead chokes during sub-critical flow of gas condensates. Journal of Petroleum Science and Engineering, 60(3-4), 205-212.
[2] Al-Safran, E. M. (2015). Prediction of two-phase critical flow through chokes. Journal of Petroleum Science and Engineering, 135: 548-555.
[3] Nasriani, H. R & Kalantariasl, A. (2011). Two-phase flow choke performance in high-rate gas condensate wells. SPE Asia Pacific Oil and Gas Conference and Exhibition.
[4] Mirzaei-Paiaman, A & Salavati, S. (2013). A new empirical correlation for sonic simultaneousflow of oil and gas through wellhead chokes for Persian oil fields. Energy Sources, PartA, 35(9): 817-825.
[5] Fuladgar, A. M. (2020). New empirical correlation for oil flowrate prediction through chokes. Journal of the Serbian Chemical Society, 85(5): 687-696.
[6] Seidi, S. & Sayahi, T. (2015). Genetic algorithm and non-linear regression analysis for predicting sub-critical two-phase flow pressure drop through chokes. Journal of Petroleum Science and Engineering, 135: 548-555.
[7] Alvarez, L., Mohan, R. S, Shoham, O., Gomez, L.& Avila, C. (2013). Multiphaseflow splitting in looped pipelines. In Integral methods in science and engineering, pp. 1-12. Springer.
[8] Mirzaei-Paiaman, A. & Nourani, M. (2012). Positive effect of earthquake waves On well productivity: Case study of an Iranian carbonate gas condensate reservoir. Scientia Iranica, 2012; 19(6): 1601-1607.
[9] Abedelrigeeb, A., Al-Khudafi, A. M., Baarimah, S. O & Ba-Jaalah, K. S. (2019). Hybrid artificial intelligent approach for choke size estimation in volatile and black oil reservoirs. First International Conference of Intelligent Computing and Engineering (ICOICE), 1-5.
[10] Akbari, A., Ghazi, F., & Kazemzadeh, Y. (2025). Machine learning-based prediction of well performance parameters for wellhead choke flow optimization. Scientific Reports, 15(1), 44182.
[11] Akbari, A. & Rahimi, M. (2026). Prediction of well performance parameters for wellhead choke flow optimization using MLP-GA, 2026.
[12] Dabiri, M. S., Hadavimoghaddam, F., Ashoorian, S., Schaffie, M., & Hemmati-Sarapardeh, A. (2024). Modeling liquid rate through wellhead chokes using machine learning techniques. Scientific Reports, 14(1), 6945.
[13] Xun, Z., Altalbawy, F. M. A, Kanjariya, P., Manjunatha, R., Shit, D., Nirmala, M., Sharma, A., Hota, S., Shomurotova, S., Sead, F. F, Abbasi, H. & Alam, M. M. (2025). Developing a cost-effective tool for choke flow rate prediction in sub-critical oil wells using wellhead data. Scientific Reports, 15, 25825.
[14] Ghorbani, H., Moghadasi, J. & Wood, D. A. (2017). Prediction of gas flow rates from gas condensate reservoirs through wellhead chokes using a firefly optimization algorithm. Journal of Natural Gas Science and Engineering, 45: 256-271.
[15] Ghorbani, H., Wood, D. A., Choubineh, A., Mohamadian, N., Tatar, A., Farhangian, H & Nikooey, A. (2019). Predicting liquid flow-rate performance through wellhead chokes with genetic and solver optimizers: An oil field case study. Journal of Petroleum Exploration and Production Technology, 9: 1355-1373.
[16] Rajabi Behesht Abad, A., Mohamadian, N., Davoodi, S., Khezerloo-ye Aghdam, S., Ghorbani, H., Mehrad, M. & Nasriani, H. R. (2022). Robust hybrid machine learning algorithms for gas flow rates prediction through wellhead chokes in gas condensate fields. Fuel, 308, 121872.
[17] Ghorbani, H., Wood, D. A, Choubineh, A., Tata, A., Ghazaeipour Abarghoyi, P., Madani, M., & Mohamadian, N. (2020). Prediction of oil flow rate through an orifice flow meter: Artificial intelligence alternatives compared. Petroleum, 6(4), 404-414.
[18] Al-Ajmi, M. D., Alarifi, S. A & Mahsoon, A. H. (2015). Improving multiphase choke performance prediction and well production test validation using artificial intelligence: A new milestone. SPE Digital Energy Conference and Exhibition,
[19] Bikmukhametov, T. & Jäschke, J. (2020). First principles and machine learning virtual flow metering: A literature review. Journal of Petroleum Science and Engineering, 184, 106487.
[20] Hotvedt, M., Grimstad, B., & Jäschke, J. (2020). Developing a hybrid data-driven, mechanistic virtual flow meter: A case study. IFAC-Papers On Line, 53(2), 11692-11697.
[21] Al-Qutami, T., Ibrahim, R., Ismail, I., & Ishak, M. A. (2018). Virtual multiphase flow metering using diverse neural network ensemble and adaptive simulated annealing. Expert Systems with Applications, 93, 72-85.
[22] Kaleem, W., Tewari, S., Fogat, M., & Martyushev, D. A. A. (2024). Hybrid machine learning approach based study of production forecasting and factors influencing the multiphase flow through surface chokes. Petroleum, 10(2), 354-371.
[23] Huang, K., Fu, Y., & Guo, Y. (2025). Wellhead choke performance for multiphase flow back: A data-driven investigation on shale gas wells. Energies, 18(16), 4381.
[24] BinZiad, A., Khan, A. M., Alshammari, F. O & Alsubaii, A. (2024). Gas rate predictive model as an alternative to choke equations. SPE GOTECH Conference.
[25] Onyeabor, J. (2023). Modelling of multiphase flow through a subsea recirculation line equipped with a choke (Master’s thesis, University of Bergen),
[26] Onuh, C. Y., Alaigba, D., Rotimi, O. J & Arowolo, B. T. (2017). Well placement optimization using a basic genetic search heuristics algorithm and a black oil simulator. Open Journal of Yangtze Oil and Gas, 2(4): 214-225.
[27] Kherroubi, D., Cristea, Z., Berrahmoun, H., Brough, B., et al. (2022). Application of autonomous inflow control valve (AICV) in reducing gas production in ultra-light oil reservoir: Case study. SPE Annual Technical Conference and Exhibition, 2022.
[28] Economides, M. J, Hill, A. D, Ehlig-Economides, C.& Zhu, D. (2014). Petroleum production systems. Second Edition. New Jersey: Pearson Education, Inc; 2014, pp 236-247.
[29] Henriksen, K. H, Gule, E. I & Augustine, J. R. (2006). Application of inflow control devices for water production management. SPE Annual Technical Conference and Exhibition.
[30] Gilbert, W. E. (1954). Flowing and gas-lift well performance. In Drilling and Production Practice, American Petroleum Institute (API), 13, pp. 126-157.
[31] Khamis, M., Elhaj, M. & Abdulraheem, A. (2020). Optimization of choke size for two-phase flow using artificial intelligence. Journal of Petroleum Exploration and Production Technology, 10(2): 487-500.
[32] Carstensen, C. M & Kanstad, S. K. (2022). Multiphase flow through chokes: An evaluation of frozen, equilibrium, and nonequilibrium flow models. Journal of Petroleum Science and Engineering, 215, 110402.
[33] Ashford, F. E & Pierce, P. E. (1975). Determining multiphase pressure drops and flow capacities in down-hole safety valves. Journal of Petroleum Technology, 27(10), 1145-1152.
[34] Ros, N. C. J. (1960). An analysis of critical simultaneous flow through restrictions and its application to flow metering. Journal of Petroleum Technology, 12(9): 73-79.
Cite This Article
  • APA Style

    Awara, L. F., Kinate, B. B., Igwe, I. (2026). Hybrid Multi-phase Choke Model for Predicting Pressure Drop and Choke Size for Production Optimization. Petroleum Science and Engineering, 10(2), 85-99. https://doi.org/10.11648/j.pse.20261002.12

    Copy | Download

    ACS Style

    Awara, L. F.; Kinate, B. B.; Igwe, I. Hybrid Multi-phase Choke Model for Predicting Pressure Drop and Choke Size for Production Optimization. Pet. Sci. Eng. 2026, 10(2), 85-99. doi: 10.11648/j.pse.20261002.12

    Copy | Download

    AMA Style

    Awara LF, Kinate BB, Igwe I. Hybrid Multi-phase Choke Model for Predicting Pressure Drop and Choke Size for Production Optimization. Pet Sci Eng. 2026;10(2):85-99. doi: 10.11648/j.pse.20261002.12

    Copy | Download

  • @article{10.11648/j.pse.20261002.12,
      author = {Lolo Festus Awara and Bright Bariakpoa Kinate and Ikechi Igwe},
      title = {Hybrid Multi-phase Choke Model for Predicting Pressure Drop and Choke Size for Production Optimization},
      journal = {Petroleum Science and Engineering},
      volume = {10},
      number = {2},
      pages = {85-99},
      doi = {10.11648/j.pse.20261002.12},
      url = {https://doi.org/10.11648/j.pse.20261002.12},
      eprint = {https://article.sciencepublishinggroup.com/pdf/10.11648.j.pse.20261002.12},
      abstract = {This study addresses the problem of pressure drop and choke size prediction a in high water -cut oil wells by developing a New Multi-Phase Choke Formula (NMPCF) (a hybrid multi-phase choke model), to improve prediction accuracy and operational performance. A robust predictive model was developed that integrates mechanistic, empirical, and machine learning approaches for estimating pressure drop (ΔP) and choke size (Cₛ). Historical well test data were obtained from two fields in Niger Delta with choke sizes ranging from 0.1875-0.4375 inches, flow rates of 270-1673 bbl/day, and water cuts up to 40.26%. Data preprocessing and model implementation were carried out using Python, leveraging libraries such as NumPy, SciPy, and scikit-learn. Random Forest regression was trained on an 80/20 train-test split to learn nonlinear relationships and provide correction terms to the mechanistic model. Results show that the coefficient of determination (R2) is greater than 0.85. The dataset of 1000 samples exhibited a mean water cut of 0.52 and mean choke size of 63.87 inches enhancing model generalization. Pressure drop increased nonlinearly with water cut (Wc), particularly beyond Wc = 0.5, due to increased mixture density and viscosity. The model maintained stable predictions across average flow rates of 420.71 bbl/day. The NMPCF model provides improved accuracy for predicting pressure drop and choke size, making it suitable for optimizing production in high water-cut oil wells.},
     year = {2026}
    }
    

    Copy | Download

  • TY  - JOUR
    T1  - Hybrid Multi-phase Choke Model for Predicting Pressure Drop and Choke Size for Production Optimization
    AU  - Lolo Festus Awara
    AU  - Bright Bariakpoa Kinate
    AU  - Ikechi Igwe
    Y1  - 2026/08/22
    PY  - 2026
    N1  - https://doi.org/10.11648/j.pse.20261002.12
    DO  - 10.11648/j.pse.20261002.12
    T2  - Petroleum Science and Engineering
    JF  - Petroleum Science and Engineering
    JO  - Petroleum Science and Engineering
    SP  - 85
    EP  - 99
    PB  - Science Publishing Group
    SN  - 2640-4516
    UR  - https://doi.org/10.11648/j.pse.20261002.12
    AB  - This study addresses the problem of pressure drop and choke size prediction a in high water -cut oil wells by developing a New Multi-Phase Choke Formula (NMPCF) (a hybrid multi-phase choke model), to improve prediction accuracy and operational performance. A robust predictive model was developed that integrates mechanistic, empirical, and machine learning approaches for estimating pressure drop (ΔP) and choke size (Cₛ). Historical well test data were obtained from two fields in Niger Delta with choke sizes ranging from 0.1875-0.4375 inches, flow rates of 270-1673 bbl/day, and water cuts up to 40.26%. Data preprocessing and model implementation were carried out using Python, leveraging libraries such as NumPy, SciPy, and scikit-learn. Random Forest regression was trained on an 80/20 train-test split to learn nonlinear relationships and provide correction terms to the mechanistic model. Results show that the coefficient of determination (R2) is greater than 0.85. The dataset of 1000 samples exhibited a mean water cut of 0.52 and mean choke size of 63.87 inches enhancing model generalization. Pressure drop increased nonlinearly with water cut (Wc), particularly beyond Wc = 0.5, due to increased mixture density and viscosity. The model maintained stable predictions across average flow rates of 420.71 bbl/day. The NMPCF model provides improved accuracy for predicting pressure drop and choke size, making it suitable for optimizing production in high water-cut oil wells.
    VL  - 10
    IS  - 2
    ER  - 

    Copy | Download

Author Information
  • Abstract
  • Keywords
  • Document Sections

    1. 1. Introduction
    2. 2. Methodology
    3. 3. Results and Discussion
    4. 4. Conclusions
    Show Full Outline
  • Abbreviations
  • Author Contributions
  • Conflicts of Interest
  • References
  • Cite This Article
  • Author Information